Download

1 / 36
490 likes | 1.12k Vues
Algebra1 Rate of Change and Slope. Warm Up. Find the domain and range of each relation, and tell whether the relation is a function. 1) {(3, 4) , (3, 2) , (3, 0) , (3, -2)}. 2). 1) D: (3) R: (4, 2, 0, -2) not a function. 2) D: (0, 2, 4, -2, -4) R: (0, 2, 4, 2, 4)

E N D
Algebra1Rate of Changeand Slope CONFIDENTIAL
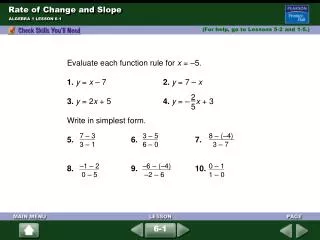
Warm Up Find the domain and range of each relation, and tell whether the relation is a function. 1) {(3, 4) , (3, 2) , (3, 0) , (3, -2)} 2) 1) D: (3) R: (4, 2, 0, -2) not a function 2) D: (0, 2, 4, -2, -4) R: (0, 2, 4, 2, 4) Relation is a function. CONFIDENTIAL
Rate of Change and Slope A rate of change is a ratio that compares the amount of change in a dependent variable to the amount of change in an independent variable. Rate of change = Change in dependent variable Change in independent variable Rates of change can be used to find how quickly costs have increased. CONFIDENTIAL
Consumer Application The table shows the cost of mailing a 1-ounce letter in different years. Find the rate of change in cost for each time interval. During which time interval did the cost increase at the greatest rate? Step1: Identify the dependent and independent variables. dependent: cost independent: year Step2: Find the rates of change. change in cost = _25 -22_ = 3 = 1 change in years 1988 – 1985 3 1985 to 1988 1 cent/year Next slide CONFIDENTIAL
change in cost = _25 -25_ = 0 = 0 change in years 1990 – 1988 2 1988 to 1990 0 cent/year change in cost = _29 -25_ = 4 = 4 change in years 1991 – 1990 1 1990 to 1991 4 cents/year change in cost = _37 -29_ = 8 = 0 change in years 2004 – 1991 13 1991 to 2004 8/13 cents/year The cost increased at the greatest rate from 1990 to 1991. CONFIDENTIAL
Now you try! 1) The table shows the balance of a bank account on different days of the month. Find the rate of change during each time interval. During which time interval did the balance decrease at the greatest rate? 1) 1 to 6 = 53 dollars/day decrease 6 to 16 = 7.5 dollars/day decrease 16 to 22 = 0 dollars/day decrease 22 to 30 = 4.375 dollars/day decrease During time interval 1 to 6 the balance decreased at the greatest rate. CONFIDENTIAL
Finding Rates of Change from a Graph 2) Graph the data from Example 1 and show the rates of change. Graph the ordered pairs. The vertical blue segments show the changes in the dependent variable, and the horizontal green segments show the changes in the independent variable. Notice that the greatest rate of change is represented by the steepest of the red line segments. Also notice that between 1988 and 1990, when the cost did not change, the red line segment is horizontal. CONFIDENTIAL
Now you try! 2) Graph the data from the given table and show the rates of change. 2) The x-intercept is -2. The y-intercept is 3. CONFIDENTIAL
Slope of a Line If all of the segments have the same rate of change, then they all have the same steepness and together form a straight line. The constant rate of change of a line is called the slope of the line. The rise is the difference in the y-values of two points on a line. The run is the difference in the x-values of two points on a line. The slope of a line is the ratio of rise to run for any two points on the line. slope = rise = Change in y run Change in x CONFIDENTIAL Next slide
(Remember that yis the dependent variableand xis the independent variable.) CONFIDENTIAL
Finding Slope 3) Find the slope of the line. Begin at one point and count vertically to find the rise. Then count horizontally to the second point to find the run. It does not matter which point you start with. The slope is the same. slope = 2 = 2 1 slope = -2 = 2 -1 CONFIDENTIAL
Now you try! 3) Find the slope of the line that contains (0, -3) and (5, -5) . 3) slope = -5 2 CONFIDENTIAL
Finding Slopes of Horizontal and Vertical Lines 4) Find the slope of each line. A) B) slope = rise = 0 = 0 run 4 slope = rise = 2 run 0 You cannot divide by 0. The slope is 0. The slope is undefined. CONFIDENTIAL
Now you try! 4) Find the slope of each line. A) B) 4a) slope = -3 – 5 . The slope is undefined. 0 - 0 4b) slope = -4 – (-4) . The slope is 0. 4 - 0 CONFIDENTIAL
As shown in the previous examples, slope can be positive, negative, zero, or undefined. You can tell which of these is the case by looking at the graph of a line—you do not need to calculate the slope. CONFIDENTIAL
Describing Slope 5) Tell whether the slope of each line is positive, negative, zero, or undefined. A) B) The line falls from left to right. The slope is negative. The line is horizontal. The slope is 0. CONFIDENTIAL
Now you try! 5) Tell whether the slope of each line is positive, negative, zero, or undefined. A) B) 5a) The line is vertical. undefined slope. 5b) The rises from left to right. The slope is positive. CONFIDENTIAL
The line with slope 4 is steeper than the line with slope 1 | 4 | > 1 2 2 Comparing Slope Remember that the slope of a line is its steepness. Some lines are steeper than others. As the absolute value of the slope increases, the line becomes steeper. As the absolute value of the slope decreases, the line becomes less steep. CONFIDENTIAL
The line with slope -3 is steeper than the line with slope 3 | -3 | >| 3 | 4 | 4 | The line with slope -2 is steeper than the line with slope -1. | -2 | > | -1 | CONFIDENTIAL
Now you try! 6) What is the rise shown in the graph? What is the run? What is the slope? 6) rise = 6; run = 5; slope = 6/5 CONFIDENTIAL
Assessment 1) The table shows the volume of gasoline in a gas tank at different times. Find the rate of change for each time interval. During which time interval did the volume decrease at the greatest rate? 2) The table shows a person’s heart rate over time. Graph the data and show the rates of change. CONFIDENTIAL
150 125 100 75 50 25 0 2 4 6 8 10 12 1) 0 to 1 = 3 gallons/hr decrease 1 to 3 = 2 gallons/hrdecrease 3 to 6 = 4/3 gallons/hrdecrease 6 to 7 = 0 gallons/hrdecrease During time interval 0 to 1 the volume decreased at the greatest rate. 2) 1) 0 to 2 = 14 beats/min2 increase 2 to 5 = 18 beats/min2increase 5 to 6 = 20.3 beats/min2decrease 7 to 10 = 6.3 beats/min2decrease CONFIDENTIAL
Find the slope of each line. 3) 4) 3) slope = 0.5 4) slope = 0 CONFIDENTIAL
Tell whether the slope of each line is positive, negative, zero, or undefined. 6) 5) 5) The line falls from left to right. The slope is negative. 6) The line is vertical. Undefined slope. CONFIDENTIAL
7) The slope of which line has the greatest absolute value? 8) For which line is the run equal to 0? 7) line C 8) line D CONFIDENTIAL
Let’s review Let’s review Rate of Change and Slope A rate of change is a ratio that compares the amount of change in a dependent variable to the amount of change in an independent variable. Rate of change = Change in dependent variable Change in independent variable Rates of change can be used to find how quickly costs have increased. CONFIDENTIAL
Consumer Application The table shows the cost of mailing a 1-ounce letter in different years. Find the rate of change in cost for each time interval. During which time interval did the cost increase at the greatest rate? Step1: Identify the dependent and independent variables. dependent: cost independent: year Step2: Find the rates of change. change in cost = _25 -22_ = 3 = 1 change in years 1988 – 1985 3 1985 to 1988 1 cent/year Next slide CONFIDENTIAL
change in cost = _25 -25_ = 0 = 0 change in years 1990 – 1988 2 1988 to 1990 0 cent/year change in cost = _29 -25_ = 4 = 4 change in years 1991 – 1990 1 1990 to 1991 4 cents/year change in cost = _37 -29_ = 8 = 0 change in years 2004 – 1991 13 1991 to 2004 8/13 cents/year The cost increased at the greatest rate from 1990 to 1991. CONFIDENTIAL
Finding Rates of Change from a Graph 2) Graph the data from Example 1 and show the rates of change. Graph the ordered pairs. The vertical blue segments show the changes in the dependent variable, and the horizontal green segments show the changes in the independent variable. Notice that the greatest rate of change is represented by the steepest of the red line segments. Also notice that between 1988 and 1990, when the cost did not change, the red line segment is horizontal. CONFIDENTIAL
Slope of a Line If all of the segments have the same rate of change, then they all have the same steepness and together form a straight line. The constant rate of change of a line is called the slope of the line. The rise is the difference in the y-values of two points on a line. The run is the difference in the x-values of two points on a line. The slope of a line is the ratio of rise to run for any two points on the line. slope = rise = Change in y run Change in x CONFIDENTIAL Next slide
(Remember that yis the dependent variableand xis the independent variable.) CONFIDENTIAL
Finding Slope 3) Find the slope of the line. Begin at one point and count vertically to find the rise. Then count horizontally to the second point to find the run. It does not matter which point you start with. The slope is the same. slope = 2 = 2 1 slope = -2 = 2 -1 CONFIDENTIAL
As shown in the previous examples, slope can be positive, negative, zero, or undefined. You can tell which of these is the case by looking at the graph of a line—you do not need to calculate the slope. CONFIDENTIAL
Describing Slope 5) Tell whether the slope of each line is positive, negative, zero, or undefined. A) B) The line falls from left to right. The slope is negative. The line is horizontal. The slope is 0. CONFIDENTIAL
The line with slope 4 is steeper than the line with slope 1 | 4 | > 1 2 2 Comparing Slope Remember that the slope of a line is its steepness. Some lines are steeper than others. As the absolute value of the slope increases, the line becomes steeper. As the absolute value of the slope decreases, the line becomes less steep. CONFIDENTIAL
You did a great job today! CONFIDENTIAL