Download
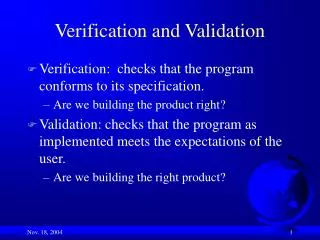
1 / 16
160 likes | 402 Vues
SweEt validation of Cereal samples – LC-MS/MS analysis. Anne Kruse Lykkeberg; Gitte Andersen & Mette Erecius Poulsen; Nordic Pesticide Workshop, 2013, Porvoo / Borgå. Agenda. Short summary of the Method Non-linear standard curves Validation. SweEtSample Clean up. LC- method.

E N D
SweEt validation of Cereal samples – LC-MS/MS analysis Anne Kruse Lykkeberg; Gitte Andersen & Mette Erecius Poulsen; Nordic Pesticide Workshop, 2013, Porvoo/Borgå
Agenda • Short summary of the Method • Non-linear standard curves • Validation
LC-method • Analytical column: Genesis C18, 100x3 mm, 4 µm • Solvent A: 10/90 metanol/10 mM ammonium formate, pH 4 • Solvent B: Methanol
Injection volumen - chromatograms Fenhexamid 5 µl 2 µl 0.001 mg/kg 1.00 mg/kg
Initial validation – LC-compounds • 28 compounds out of 34 had acceptable recoveries
Spiroxamin • LogP = 2.89 • Low sensitivity LOD = 0.04 ng/ml • Only i SWEET – not QuEChERS • Recovery is good at the highest level
Conclusions • Samples in ethylacetate gives non linear standard curves for manypesticides • Using Quadraticfit and i few cases Cubicfit gives • Acceptable residuals with random distributions • Acceptable recoveries at threelevels • Compounds with Log P below 0 gives a poorrecoveryusing the SweEtmethod
Thankyou for your attention