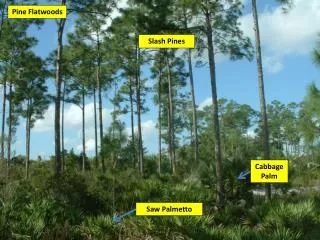
Small-Block Pine
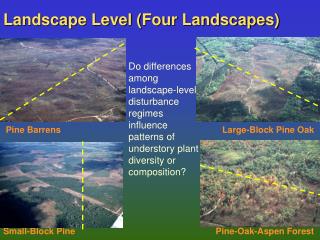
Landscape Level (Four Landscapes). Do differences among landscape-level disturbance regimes influence patterns of understory plant diversity or composition?. Pine Barrens. Large-Block Pine Oak. Small-Block Pine. Pine-Oak-Aspen Forest. Brosofske et al. Large-Block PO. Pine Barrens. BOPB.

Small-Block Pine
E N D
Presentation Transcript
Landscape Level (Four Landscapes) Do differences among landscape-level disturbance regimes influence patterns of understory plant diversity or composition? Pine Barrens Large-Block Pine Oak Small-Block Pine Pine-Oak-Aspen Forest
Brosofske et al. Large-Block PO Pine Barrens BOPB YA2 PA H2 ORP15 MA RP15 H1 MP JPO OCC POA OPB NCC OCC OBCC H F H H OCC RP5 F2 OPB SPB YA2 JPO SPB CC Access Road Sand Road- Mod. Use Old Harvest Landing Sand Road- Light Use POA Forest Small-Block Pine Number of Species H2 Clearing RP7 OCC TRP60 OCC RP7 OCC RP60 MP H2 F2 MP RRP RP12 TRP60 RJP F2 H C H H H H F ATV Trail C C Dry Streambed Grassy Roadside Distance (m) Cumulative Species Richness
1500 Scale 1000 500 1000 0 Resolution (m) 1.2 0.6 0 W. Var. Access Road 500 Sand Road- Mod. Use E Old Harvest Landing W 0 Sand Road- Light Use H’ 0 1.0 2.0 Clearing OPB MA YA2 JPO SPB OPB SPB CC YA2 H1 PA BOPB OPB H2 0 1000 2000 3000 Distance (m) Wavelet Analysis of Shannon Diversity (H’) 1500
(a) Morlet wavelet of arbitrary width and amplitude, with time along the x-axis. (b) Construction of the Morlet wavelet (blue dashed) as a Sine curve (green) modulated by a Gaussian (red).
LOW HIGH MA YA2 OPB H2 H1 PA CC OPB SPB YA2 BOPB SPB JPO 1500 1000 500 0 0 500 1000 1500 2000 2500 3000 Wavelet Transform of Species Richness • Pine Barrens Resolution (m) Distance Along Transect (m) Wavelet Variance
MA YA2 H2 H1 PA CC OPB OPB SPB YA2 BOPB SPB JPO ORP15 JPO RP15 MP POA NCC OCC OCC F2 OBCC H F H H OCC RP5 Pine Barrens Large-Block PO Access Road Sand Road- Mod. Use Old Harvest Landing Sand Road- Light Use 1500 1500 Resolution (m) Small-Block Pine POA Forest 1000 1000 Clearing ATV Trail 500 500 Dry Streambed E W 0 0 Grassy Roadside 0 0 500 500 1000 1000 1500 1500 2000 2000 2500 2500 3000 3000 MP TRP60 RP7 OCC RP7 OCC OCC RP60 F2 H2 H2 RP12 RRP TRP60 RJP H MP H C H H F H F2 C C Distance (m) Wavelet Analysis Comparison
Sea surface temperatures averaged over the NINO3 region in the eastern Pacific (5°S-5°N, 90°W-150°W). Blue curve is low-pass filtered (>12 months) SST. Yellow background curve is running 15-year variance, plotted at mid-point of 15-year period. Curve has been reproduced upside-down to show "envelope" of variance.
a) Time series of El Niño sea surface temperature. (b) The wavelet power spectrum, using the Morlet wavelet. The x-axis is the wavelet location in time. The y-axis is the wavelet period in years. The black contours are the 10% significance regions, using a red-noise background spectrum. The red areas indicate that high El Niño activity occurred during 1880-1920 and 1965-present, while 1920-1960 was relatively calm. Comparing Figures 1 and 3 it is now much clearer that there was large power in the 2-7 year ENSO period during both the earlier and latter parts of this century. In addition we can now see hints of a 16-year oscillation as well as power at even lower frequencies
+ Variability Complexity of interactions among of structure and human, biological,geologic, composition and climate systems + + + Ecosystem Function productivity diversity Stability … Spatial and Temporal Scale