Download
1 / 3
30 likes | 136 Vues
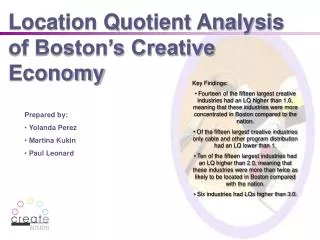
Location Quotient Analysis of Boston’s Creative Economy. Key Findings: Fourteen of the fifteen largest creative industries had an LQ higher than 1.0, meaning that these industries were more concentrated in Boston compared to the nation.

E N D
Location Quotient Analysis of Boston’s Creative Economy • Key Findings: • Fourteen of the fifteen largest creative industries had an LQ higher than 1.0, meaning that these industries were more concentrated in Boston compared to the nation. • Of the fifteen largest creative industries only cable and other program distribution had an LQ lower than 1. • Ten of the fifteen largest industries had an LQ higher than 2.0, meaning that these industries were more than twice as likely to be located in Boston compared with the nation. • Six industries had LQs higher than 3.0. • Prepared by: • Yolanda Perez • Martina Kukin • Paul Leonard
Location quotient analysis is a powerful analysis tool • Location Quotients • A useful step in the economic analysis of a locality is to determine the industry structure of the area, and how this may differ from the nation’s industry structure. • Using the Location Quotient (LQ), we are able to determine what industries are more concentrated or less concentrated in Boston when compared with the nation. • To determine the LQ of an industry we first determine what percentage the local industry’s employment is compared to the total local employment. Next, taking the same industry nationally we determine what percentage the industry’s employment is compared to the total national employment. The location quotient is simply the ratio of these two values with the local share as the numerator and the national share as the denominator. • If the industry has a location quotient greater than 1.0, it is more concentrated in the local economy compared to the nation. An LQ less than 1.0 means that the industry is less concentrated in the local economy. An LQ equal to 1.0 means that the local economy has the same share of its total employment in that industry as the nation. • Some industries may have very high location quotients; a locality relies more on these industries than the nation in the size and structure of its economy. • .For example, an industry that has an LQ of 3.0 has an employment share three times greater in the local economy compared to the national economy, while an industry with an LQ of 0.5 has an employment share half the size locally compared to the nation. • It would be advantageous if the industries with large location quotients are also the same exact industries that are experiencing significant employment growth. If this is so, the economy is healthy.
Low LQ High LQ 0.50 0.75 1.00 1.25 1.50 Nearly all the largest creative industries have very high LQs Eployment Share Equal to U.S. Museums Direct Mail Advertising Architectural Services Book Publishers Promoters of Entertainment Events w/o Facility Television Broadcasting Cable Networks Radio Broadcasting Musical Groups Advertising Agencies Book Stores and News Dealers Newspaper Publishers Cable and Other Program Distribution Periodical Publishers