Download
1 / 83
830 likes | 1.05k Vues
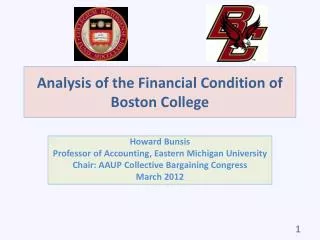
Analysis of the Financial Condition of Boston College. Howard Bunsis Professor of Accounting, Eastern Michigan University Chair: AAUP Collective Bargaining Congress March 2012. Executive Summary. Boston College is in excellent financial condition This conclusion is supported by:

E N D
Analysis of the Financial Condition of Boston College Howard Bunsis Professor of Accounting, Eastern Michigan University Chair: AAUP Collective Bargaining Congress March 2012
Executive Summary • Boston College is in excellent financial condition • This conclusion is supported by: • Strong reserves • Manageable debt • Revenues exceeding expenses • Strong cash flows • Very high bond rating • There has been a larger increase in the number and dollars devoted to administration than to faculty and instructional costs • If there are cuts to be made, they should first be made to administration. If that cannot happen, then reserves should be utilized. There is no need to make any cuts to the core academic mission.
Roadmap • Analysis of Financial Performance • Basic ratios • Bond ratings • Revenues: Where is the money coming from? Tuition, grants, contracts, feds, state, endowment income • Expenses: Are they devoting sufficient resources to the core academic mission? Focus on the number and salaries of administrators • Other metrics: Class size, tuition increases. Are students paying more and getting less?
Main Data Sources • Audited financial statements. • Budgets. This is a loaded word. The key fact is this: • Audited financial statements report what happened. • Budgets predict what will happen. • IRS 990: Publicly available only through 6/30/2010 • Timing: • Audited financial statements are available for the year ended May of 2011. • The budget for the current year (2011-12) is already done; the budget has just been approved for the 2012-13 academic year. • The 990 is due 4 ½ months after the fiscal year end; an automatic 3-month extension is typically utilized, giving the administration until 1/15/2012. Any further extension beyond 1/15/2012 requires special circumstances. By now, the 990 for the year ended 5/30/11 has been filed. • The administration claims that the 990 has not been filed yet; that is likely not the case
Other Data Sources • Office of Institutional Research. This office houses data on enrollment, number of faculty, administrators, tuition, degrees conferred, and graduation rates • IPEDS (Integrated Postsecondary Education Data System) for detailed revenue and expense analysis • AAUP Salary Surveys • Common Data Set for class size and other employee information • EADA (Equity in Athletic Data Analysis) for athletic expenses • USA Today for athletic revenues • Moody’s and S&P bond rating
Statement of Net Assets Summary • The percentage of net assets (assets minus liabilities) is high • This percentage declined in 2009 due to the decline in the value of the endowment
Asset Composition • Investments are mostly the endowment, and are the dominant asset • BC has over $2 billion in investments • The large decline in investments (endowment) from 2008 to 2009 is clear. The endowment has recovered from the prior loss. We will see how endowment income covers some expenses • The growth in capital assets is due to new buildings
2011 Asset Composition Total Assets = $3.5 Billion
Investment Composition:Source: Notes to Audited Financial Statements • Most private universities provide more detail than above • There are typically more categories, and the equities category is broken down • There is also a reporting of “alternative investments,” which is not reported by BC
Investment Composition by Level • Level 1 are stocks and mutual funds. Level 2 has a published net asset value. Level 3 investments (most risky; think Madoff) do not have an observable market • The largest investments were in level 3 assets in 2009; that has now changed. • Overall, this demonstrates that the administration is playing high finance, and feels good about its financial situation
Endowments of Peer Institutions BC Endowment is $1.7 billion
Liability Composition • There are annual increases in debt in 2009 and 2011. • In November of 2010 (in 2011 above), BC issued $195 million of debt to retire old debt, build a new academic building, and fund project costs • We will soon examine if this is too much debt: • Can they make the principle and interest payments? • Is the debt large relative to reserves?
Net Asset Composition • As we will see, not all of the unrestricted net assets are available as reserves. • The decline in 2009 is due to stock market losses. • It is healthy that there are over $2 billion of net assets – we will see how much in real reserves there are
Unrestricted Net Asset Composition • In 2011, of the $1.3 billion in unrestricted net assets, $396 million of the $1.3 billion is for the value of buildings, and is not a true reserve • There was a large decline in unrestricted reserves in 2009 due to paper losses on the endowment • There is still over $900 million of unrestricted reserves at the end of 2011. We will compare these to total expenses next
Definition of Net Asset CategoriesSource: Page 5 of 2011 Audited Financial Statements • Unrestricted – Net assets that are not subject to donor-imposed stipulations. Unrestricted net assets may be designated for specific purposes by action of the Board of Trustees. • Temporarily Restricted - Net assets whose use is limited by law or donor-imposed stipulations that will either expire with the passage of time or be fulfilled or removed by actions of the University. • Permanently Restricted - Reflects the historical value of contributions (and in certain circumstances investment returns from those contributions), subject to donor-imposed stipulations, which require the corpus to be invested in perpetuity to produce income for general or specific purposes.
More on Unrestricted Net Assets • The unrestricted category overstates what is available to the administration, and we conservatively make an adjustment for this accounting construct. • The amount that is invested in plant assets is not available for the university (the university is not going to sell the buildings), and this amount is subtracted when analyzing the net assets of a private university. • Reserves are the numerical sum of temporarily restricted net assets and the portion of unrestricted net assetsunrelated to plant (buildings that are free of debt)
Reserves Total Net Assets Permanently Restricted Unrestricted Net Assets Temporarily Restricted Net Assets = + + Independent of Property and equipment Related to property and equipment Reserves or Expendable Net Assets Temporarily Restricted Expendable Unrestricted independent of property and equipment = +
Primary Reserve Ratio: Reserves vs. Expenses • The primary reserve ratio is defined as total reserves over total expenses • A ratio of 210% indicates that BC could cover 25 months of expenses; 2-3 months is considered prudent • The decline in 2009 is due to paper losses on investments • If there is a temporary budget problem, reserves should be considered before any cuts to the core academic mission • Conclusion: BC has very high reserves
Viability Ratio: Reserves vs. Debt • The viability ratio is defined as total reserves over interest-bearing debt • A ratio 175% is very strong, indicating that BC has the reserves to deal with the long term debt that it has issued.
Revenues and Expenses: Big Picture • The net income ratio is defined as the change in net assets divided by total revenues • What is more important is operating income, as non-operating items (mostly paper gains and losses on investments) have a large effect on the bottom line • Operating income is just slightly positive every year
Discussion of Non-Operating Gains and Losses • The effect of paper losses on the endowment is apparent, as there was a huge decline in 2009 (408 million), and a large gain in 2010 and 2011. • For endowment spending, BC spends 5% of a 12-quarter moving average of the endowment. • The endowment is about 1.5 billion, so 5% of that is about 75 million. The decline in the endowment affects spending, but not by large amounts as prior year spending adjusted by inflation is also considered.
Investment Returns vs. S&P 500 • The S&P 500 return is more volatile than BC’s return • BC has less negative and less positive returns than a pure equity portfolio
Moody’s Ratio Analysis • Moody’s uses three ratios to judge the financial condition of public universities. Though BC is private, the rating system is still very relevant. • Then a composite score is compiled based on these 3 ratios: • Primary Reserve Ratio • Are there sufficient reserves? • Viability Ratio • Is there too much debt? • Net Income Ratio • Are revenues and expenses in line with each other?
Moody’s Ratio Definitions • Primary reserve ratio: Expendable net assets divided by total operating expenses. • Viability ratio: Expendable net assets divided by debt. • Net Income Ratio: Change in total net assets divided by total revenues. • Final Score = 50% * Primary Reserve Ratio + 30% * Viability Ratio + 20% * Net Income Ratio
Boston College Moody’s Scores • To be in financial trouble, according to Moody’s, an institution must have a composite score of below 1.75 for two consecutive years • 5.0 is a perfect score • 4.7 is a very high rating, and is why BC has such a high bond rating, as we will see
Other Ratios: Cash Flows • Cash Flow Margin = Cash flows from operations divided by total revenues • A ratio of 13.2% is solid, and supports the conclusion that BC is in strong financial condition. • Moody’s actually has this ratio at 18.3% for 2010, not 16.4% above
Other Ratios: Debt Service • A debt service coverage ratio of 2.7 also corresponds to a bond rating of Aa, which is what BC has. • These metrics are per Moody’s Report: U.S. Not-for-Profit Private and Public Higher Education; August 26, 2011
Boston College Bond Ratings • Aa3 per Moody’s on February 24, 2010 • http://www.moodys.com/research/MOODYS-ASSIGNS-Aa3-RATING-TO-BOSTON-COLLEGES-MA-1906-MILLION-New-Issue--NIR_16641410 • Aa3 is the 4th highest possible rating out of 23 ratings • Outlook The stable outlook incorporates the College's history of operating stability and healthy market presence. Although the College's balance sheet strength is somewhat weak for its rating category, we believe operating consistency and the strong planning and management focus offset this relative weakness and expect the College to manage future debt and capital in line with growth in balance sheet resources and cash flow.
Strengths Per Moody’s Report • Excellent student market position as a Catholic Jesuit institution with growing enrollment of over 13,600 full-time equivalent students and healthy selectivity rate of 31% in fall 2010. The University's well regarded academic reputation and location in Boston bolster student demand, although the relatively modest yield rate on admitted students of 25% in fall 2010 demonstrates the highly competitive environment in which the College operates. • Highly consistent and favorable operating results. The College's operating margin has improved in recent years, resulting in a three-year average operating margin of 6.3% in FY 2010 based on Moody's methodology. A strong operating cash flow margin of 18.3% in FY 2010 produced debt service coverage of 3.2 times and would cover projected maximum annual debt service following the current issuances by 2.4 times. • Growth in financial resources in FY 2010, following declines stemming from an investment loss in FY 2009 and increase in outstanding debt. Total financial resources of $1.8 billion in FY 2010 resulted from fundraising success during the current capital campaign and an investment return of 13. 5% for the year. The College's fully fixed rate debt structure provides stability and predictability in budgeting, and liquidity is robust with 563 days cash on hand provided by unrestricted assets that can be accessed within one month.
Challenges per Moody’s Report • Higher leverage than similarly-rated peer institutions, with expendable financial resources cushioning pro-forma debt by 1.5 times in FY 2010 compared to the FY 2009 median for Aa-rated private colleges and universities of 2.3 times. In addition, expendable financial resources to operations are lower versus peers at 1.8 times in FY 2010 versus the Aa-rated median of 2.2 times in FY 2009. • Relatively high reliance on tuition and auxiliary revenues (73% of operating revenues in FY 2010 as calculated by Moody's). Slower growth in net tuition revenue per student may persist as the College implemented muted increases in tuition and fees for FY 2010 and FY 2011 while tuition discounting has increased slightly. • The College has identified a substantial number of strategic capital projects during a previously completed strategic and facilities master plan. Based on the College's current forecasts, we expect the College to prudently phase these efforts in light of the economic environment and ongoing discussions with the community regarding specific projects.
Summary of BC Ratios and Bond Ratings • Based on ratio analysis and bond ratings, it is clear that BC is in strong financial condition • Strong reserves • Manageable debt • Operating revenues exceed operating expenses every year • Strong cash flows • The next question is this: Are they spending their money in the appropriate manner? • First, we will examine where the money comes from – revenues.
Revenue Dollar AnalysisSource: Audited Financial Statements and Office of Institutional Research, Planning, and Assessment (IRPA) • Total operating revenues increase each year • This is driven by tuition and fee increases • We will examine percentage changes, as well as tuition discounting
Dollar and Revenue Percentage Change Analysis • The changes in total revenues are driven by tuition changes • The overall growth is healthy
Tuition DiscountingSource: Audited Financial Statements • The discount rate is increasing over time, and is highest in 2011. • There are other forms of aid, such as Pell Grants. This aid is given by the institution
Federal and State Dollars to Undergrad StudentsSource: IPEDS 2010 Data • BC is a private university • But there are lots of taxpayer dollars that make their way to BC
Financial Aid Breakdown:2009-10 per IPEDS • 1st column is family income level • 2nd column: Of students who receive Federal aid, what percent are in each income category. Therefore, 43% of BC students who receive federal aid have family income greater than $110,001
Expense Percentage AnalysisSource: Audited Financial Statements • Instruction is less than 40% of total expenses. We will break down instruction via IPEDS to show how much of instruction is not related to salary • General administration is down from 2009, but higher than in 2003 • Academic support also has significant administrative costs (deans)
Expense Percentage Changes • Instruction is not going up as much as general administration over the two sup-periods, as well as over the 8-year period • This is a test of whether the administration is being true to the core academic mission • It demonstrates that if cuts are to be made, administration should come before academics • We will see if IPEDS data supports these conclusions
IPEDS Categories • The next several slides reports the definitions of the different expense categories. • Instruction contains more than faculty salaries, as we will see • The main administrative category is institutional support • Academic support contains most of the academic administration, as well as other student-oriented costs.
Definition of Instruction Expense Per IPEDShttp://nces.ed.gov/ipeds/glossary/ • A functional expense category that includes expenses of the colleges, schools, departments, and other instructional divisions of the institution and expenses for departmental research and public service that are not separately budgeted. Includes general academic instruction, occupational and vocational instruction, community education, preparatory and adult basic education, and regular, special, and extension sessions. Also includes expenses for both credit and non-credit activities. • Excludes expenses for academic administration where the primary function is administration (e.g., academic deans). • Information technology expenses related to instructional activities if the institution separately budgets and expenses information technology resources are included (otherwise these expenses are included in academic support). • Institutions include actual or allocated costs for operation and maintenance of plant, interest, and depreciation.
Definition of Research Expense Per IPEDS • A functional expense category that includes expenses for activities specifically organized to produce research outcomes and commissioned by an agency either external to the institution or separately budgeted by an organizational unit within the institution. • The category includes institutes and research centers, and individual and project research. This function does not include non-research sponsored programs (e.g., training programs).
Definition of Public Service Expense Per IPEDS • A functional expense category that includes expenses for activities established primarily to provide non-instructional services beneficial to individuals and groups external to the institution. • Examples are conferences, institutes, general advisory service, reference bureaus, and similar services provided to particular sectors of the community. • This function includes expenses for community services, cooperative extension services, and public broadcasting services. • Also includes information technology expenses related to the public service activities if the institution separately budgets and expenses information technology resources (otherwise these expenses are included in academic support).
Definition of Academic Support Expense Per IPEDS • A functional expense category that includes expenses of activities and services that support the institution's primary missions of instruction, research, and public service. • It includes the retention, preservation, and display of educational materials (for example, libraries, museums, and galleries); organized activities that provide support services to the academic functions of the institution (such as a demonstration school associated with a college of education or veterinary and dental clinics if their primary purpose is to support the instructional program); media such as audiovisual services; academic administration (including academic deans but not department chairpersons); and formally organized and separately budgeted academic personnel development and course and curriculum development expenses. • Also included are information technology expenses related to academic support activities; if an institution does not separately budget and expense information technology resources, the costs associated with the three primary programs will be applied to this function and the remainder to institutional support. • Institutions include actual or allocated costs for operation and maintenance of plant, interest, and depreciation.
Definition of Student Services Expense Per IPEDS • A functional expense category that includes expenses for admissions, registrar activities, and activities whose primary purpose is to contribute to students emotional and physical well - being and to their intellectual, cultural, and social development outside the context of the formal instructional program. • Examples include student activities, cultural events, student newspapers, intramural athletics, student organizations, supplemental instruction outside the normal administration, and student records. • Intercollegiate athletics and student health services may also be included except when operated as self - supporting auxiliary enterprises. • Institutions include actual or allocated costs for operation and maintenance of plant, interest, and depreciation.
Definition of Institutional Support Expense Per IPEDS • A functional expense category that includes expenses for the day-to-day operational support of the institution. • Includes expenses for general administrative services, central executive-level activities concerned with management and long range planning, legal and fiscal operations, space management, employee personnel and records, logistical services such as purchasing and printing, and public relations and development. • Also includes information technology expenses related to institutional support activities. If an institution does not separately budget and expense information technology resources, the IT costs associated with student services and operation and maintenance of plant will also be applied to this function.