Financial Condition Analysis
This report provides an overview of the financial health of Texas community college districts, focusing on key indicators established by the Texas Association of Community Colleges Board (TACCBO). It outlines the rationale behind the annual analysis, changes made following feedback on the draft report, and opportunities for enhancement. Metrics such as the Composite Financial Index, Primary Reserve, Viability, and Operating Margin are evaluated. The report emphasizes potential financial stress indicators and the importance of comprehensive data for informed decision-making and strategic planning.

Financial Condition Analysis
E N D
Presentation Transcript
Overview Why are we doing this? How did we come up with this stuff? What changes were made after hearing back about the draft report? What improvements can be made? TACCBO 2012, Slide 2
Requirement GAA, Rider14 (page III-198) “The Coordinating Board shall provide an annual report due on May 1 to the Legislative Budget Board and Governor's Office about the financial condition of the state's community college districts.” TACCBO 2012, Slide 3
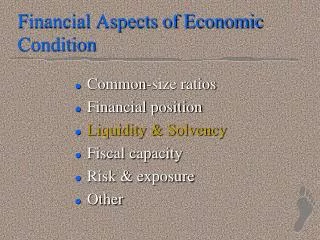
Defined 12 Indicators Used Composite Financial Index (CFI) ratios, Primary Reserve, Viability, Return on Net Assets, and Operating Margin Added metrics including enrollment, diversity of revenues, equity ratio, leverage ratio and debt burden Looked at audit findings and accreditation sanctions to round out the 12 TACCBO 2012, Slide 4
Set Thresholds Quantitative Indicators Threshold for Potential Financial Stress Composite Financial Index 2.0 or lower Primary Reserve Ratio Less than 0.13 Viability Ratio Less than 0.41 Return on Net Assets Less than zero Operating Margin Less than zero Enrollment Fluctuation Decline of >=5%; increase of >=10% Diversity of Revenues Individual source >50% of total Equity Ratio Below 20% Leverage Ratio Greater than 2.0 Debt Burden Ratio Greater than 5% Qualitative Indicators Threshold for Potential Financial Stress Audit Opinions Qualified or material IC weaknesses Accreditation Actions Sanctions imposed TACCBO 2012, Slide 5
Potential Financial Stress Indicators were measured using FY2011 data. A district was considered facing potential financial stress if they did not meet three or more of the indicators. 12 districts fell into that category; half missed 3 and the other half missed 4 or more TACCBO 2012, Slide 6
Hiccups Clerical issues with the data for 2 districts. Inverted leverage ratio. Operating margin for 9 districts corrected; mislabeled debt service TACCBO 2012, Slide 7
Feedback Largely positive. Use of language was an issue. Added trend data; concern was looking at one year in isolation wouldn’t provide bigger picture Discussion of GO debt; calculated relevant ratios both with and without GO debt and added discussion to analysis section TACCBO 2012, Slide 8
Improvements Add metric based on local tax ability? Change debt metrics? Use different metrics or add metrics? Add weights to metrics? Add other metrics to provide big picture or more nuanced understanding of financial condition? TACCBO 2012, Slide 9