Download
1 / 37
370 likes | 656 Vues
Measuring the economy and the circular flow. Measuring the GDP, economic growth and inflation. Topics. National income accounts Expenditure approach to GDP Income approach to GDP Circular Flow of income and expenditure Leakages and injections Inflation and consumer price index.

E N D
Measuring the economy and the circular flow Measuring the GDP, economic growth and inflation
Topics • National income accounts • Expenditure approach to GDP • Income approach to GDP • Circular Flow of income and expenditure • Leakages and injections • Inflation and consumer price index
What is Gross Domestic Product (GDP) • Is the value of the aggregate production of goods and services in a country during a given time period • GDP is calculated by valuing everything that is produced in a country in a year.
The question – what is valued and how it is valued – to answer this, need to understand 2 fundamental principles in economic accounting : • The distinction between flows and stocks • The equality of income, expenditure and the value of production
Flows variable and stocks variable • Capital and investment the concept of capital, investment, depreciation, gross investment and net investment • Wealth and saving the concept of wealth, consumption expenditure, saving
Flows variable and stocks variable • A flow is a quantity per unit of time – it is the value of the goods and services produced in a country during a given time period E.g. the number of CDs that you buy during a month and the amount of income that you earn during a month • A stock – is a quantity that exists at a point in time E.g. stocks of CDs you own and money in saving accounts
Capital and investment • The key macroeconomic stock is capital – such as plant, equipment, buildings, inventories of raw materials and semi finished goods that are used to produce other goods and services • 2 flows change the stock of capital: investment and depreciation
Investment is the purchase of new capital which increases the stock of capital (additions to inventories) • Depreciation is the decrease in the stock of capital that results from wear and tear • Gross investment = the total amount spent on adding to the stock of capital and on replacing depreciated capital • Net investment = gross investment - depreciation
Example of capital and investment • Suppose on Jan, 2000 – Tom’s Tapes Inc. had 3 machines – this is initial capital • During 2000, Tom’s scrapped older machine – this quantity is depreciation • After depreciation the stock of capital down to 2 machines – this is gross investment • By December 31, 2000, Tom’s Company had 4 machines, so its capital had increased by 1 machine – this is net investment • Net investment = gross investment (purchase of 2 machine) – depreciation (I machine scrapped)
Wealth and Saving • Wealth is another macroeconomic stock - is the value of all things that people own. When ‘own’ it is stock which is related to what they ‘earn’ is a flow. • People earn income, and income that is left after paying taxes is either consumed or saved • Consumption expenditure – is the amount spent on consumption of goods and services • Saving is the amount of income remaining after meeting consumption expenditures • Saving adds to wealth , and dissaving decreases wealth
Example • Suppose A has $250 in savings account and some textbooks worth $300 at the end of the school year. So A’s wealth = $550 • Suppose A do job during break and earn an income of $5,000. A only spend $1,000. • When school starts, A has $4550 in savings account • A’s wealth increase by $4,000 = saving • Saving ($4,000) = income ($5,000) – consumption expenditure ($1,000)
Main points: i. The flows of investment and saving together with the flows of income and consumption expenditure interact in a circular flow of income and expenditure (income = expenditure) ii. This equality is the foundation on which a nation’s economic accounts are built and the GDP is measured.
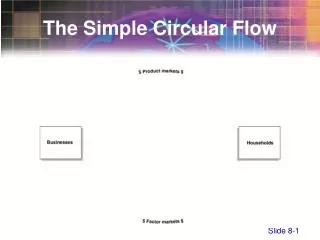
Income, Expenditure and the Value of Production • To see that for the economy as a whole, income=expenditure=production we need to study the circular flow of income and expenditure • Economy consists of 4 sectors: Households Firms Governments The rest of the world
Households and Firms • a. Households sell and firms buy the services of labor, capital, land and entrepreneurship in the resource markets. For these resources services, firms pay income (Y) to households such as wage, interest, rent, profit • b. Firms sell and households buy consumer goods & services in the goods markets. The payment households make for these goods is called consumption expenditure ( C ) • c. Firms also buy and sell new capital equipment in the goods market (e.g. IBM sells PCs to General Motors). The purchase of new plants, equipment and buildings and additions to inventories are investment (I) • d. Firms finance their investment by borrowing from households’ saving in the financial markets • Thus income is payment for the services of resource and expenditure is a payment for goods or services
2. Governments • Government buy goods & services – government purchases from firms (G) • Government use taxes (T) to pay for their purchases • When government purchases exceed net taxes – budget deficit – to finance it the government borrow from financial markets 3. Rest of the world • Firms export goods & services to the rest of the world and import goods & services from rest of the world • Net Exports (NX) = Exports (X) – Imports ( if X > M, net exports positive and vice versa)
The Circular Flow of Income and Expenditure Households’ saving Households taxes Government Income Consumption expenditure G borrowing G Goods markets Financial markets Resource markets Net exports Investment expenditure Foreign borrowing Income C Rest of the world G Net exports Firms Firms’ borrowing
GDP – the value of aggregate production in a country during a year. Production can be valued in 2 ways: i. by what buyers pay for it ii. By what it costs producers to make it which is aggregate expenditure = aggregate income Aggregate expenditure = C + I + G + NX Aggregate income = Y, Y = C + I + G + NX
Leakages Equal Injections • Leakage – any diversion of income from the spending stream; includes saving, taxes and imports • Injection – any spending other than households: investment, government purchases, exports and transfer payments • This first accounting identity leads to • Y + NT = C + I + G + (X – M) • Since income equals consumption plus saving, we can substitute C + S for Y in this equation • C + S + NT = C + I + G + (X – M) • After subtracting C from both sides and adding M to both sides, the equation reduces to • S + NT + M = I + G + X • Thus, the leakages (S, NT, and M) must equal the injections (I, G, and X) into the circular flow
Measuring GDP • There are 2 approaches: i. Expenditure approach • Adds up expenditures on all final goods and services produced in the nation during the year – personal consumption expenditures (C) , gross private domestic investment (I), government purchases (G) and net exports (NX) • Expenditures not in GDP – spending that is not part of final expenditure and not part of GDP includes – a. intermediate goods - intermediate goods are goods firms used as input for production. E.g. Dell buy computers chips from Intel. A Dell computer is final good but an Intel chip is an intermediate goods.
b. used goods These goods already counted as part of GDP in the year it was produced as new goods. E.g. a 1990 car was part of GDP in 1990. If the car is traded on the used car market in 1998 – them amount paid is not part of GDP in 1998 c. financial assets Firms often sell financial assets such as bonds and stocks to finance purchases of new capital goods. The expenditures on newly produced capital good is part of GDP but the expenditure on financial securities is not Including these expenditures will lead to double counting
ii. Income approach • Adds up all income payments for resources used to produce output in the nation during the year : compensation of employees (wages and salaries) net interest rental income corporate profits proprietors’ income
Example: Malaysia National Accounts (millions of Ringgit) Source: International Monetary Fund (IMF): International Financial Statistics Yearbook (2004)
Limitations of National Income Accounting 1. Some production is not included in GDP • GDP includes only those products that are sold in markets • Ignores “do-it-yourself” household production an economy in which householders are largely self-sufficient will understate GDP • Ignores the underground economy • All market activity that goes unreported because it’s illegal or those involved want to evade taxes
2. GDP Ignores Depreciation • In the process of producing GDP, some capital wears out or becomes obsolete • A truer picture of the net production that actually occurs during a year is found by subtracting this depreciation from GDP • Depreciation measures the value of the capital stock that is used up or becomes obsolete in the production process
3. GDP Does Not Reflect All Costs • Some production and consumption degrades the quality of our environment- pollution of lakes and rivers, mass clearing of forests, depletion of exhaustible resources • These negative externalities are largely ignored in GDP accounting
Real versus Nominal GDP • i. Nominal GDP : Gross domestic product measures the value of output in current prices Since the economy’s average price level changes over time, current-dollar comparisons across years can be misleading. Specifically, nominal GDP can increase over time because • Output increases • Prices increase • Both of these occur • Ii. Real GDP refers to GDP adjusted for changes in prices the production of goods and services valued at constant prices.
The GDP Deflator Measures the current level of prices relative to the level of prices in the base year. Reflects the prices of goods & services but not the quantities produced GDP Deflator = Nominal GDP X 100 Real GDP
The Consumer Price Index • Is a measure of the overall cost of the goods and services bought by a typical consumer. • A base year is used as a point of reference to compare the prices in other years prices in other years are expressed relative to the base-year price • Price index constructed by dividing each year’s price by the price in the base year and multiplying by 100
Example: Calculating the Consumer Price Index and the Inflation Rate
Problems with the CPI • The goal of CPI is to measure changes in the cost of living – however it is not a perfect measure of the cost of living • There are 4 main sources of bias in the CPI: i. substitution bias ii. Introduction of new goods (new goods bias) iii. Unmeasured quality change (quality change bias) iv. Outlet substitution bias
Substitution bias Changes in relative prices lead consumers to change the items they buy. E.g. changes in the price of sources of protein. If price of fish rises and the price of chicken remains unchanged, people buy more chicken and less fish. Because the CPI ignores the substitution it says the price of protein has increased when actually it is constant (same amount of protein)
New goods bias New goods keep replacing old goods E.g. PCs and typewriters – if we want to compare the price level in 1998 with that in 1978 – compare the price of PCs now and that of a typewriter in 1978 Because PCs are more expensive than typewriters, the arrivals of new goods puts an upward bias into CPI and its inflation rate
Quality change bias Many goods are highly improved from year to year – CDs, cars, computers, etc. Part of the rise in the prices of these items is a payment for improved quality and is not inflation But CPI counts the price rise as inflation and so overstates inflation
Outlet substitution bias When confronted with higher prices, people use discount stores more frequently and convenience stores less frequently This is called outlet substitution. The CPI do not monitor outlet substitutions.