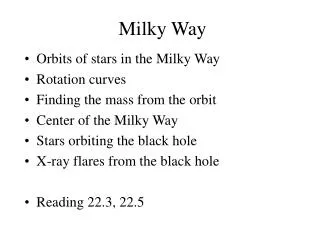
Multiwavelength Milky Way
Multiwavelength Milky Way Nine frames of Multiwavelength Milky Way credit: Dave Leisawitz Aitoff projections of Night Sky at Different Wavelengths, including 408 MHz, 240 mm, 3.5 mm, 2.5 eV, 2-10 keV, 511 keV, 1.809 MeV, > 100 MeV, and mulitwavelength mural

Multiwavelength Milky Way
E N D
Presentation Transcript
Multiwavelength Milky Way Nine frames of Multiwavelength Milky Way credit: Dave Leisawitz Aitoff projections of Night Sky at Different Wavelengths, including 408 MHz, 240 mm, 3.5 mm, 2.5 eV, 2-10 keV, 511 keV, 1.809 MeV, > 100 MeV, and mulitwavelength mural from Creatures at the Inn editor: C. Dermer
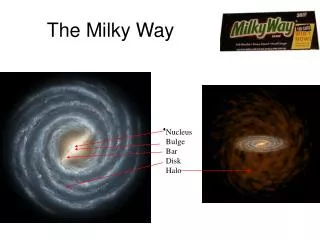
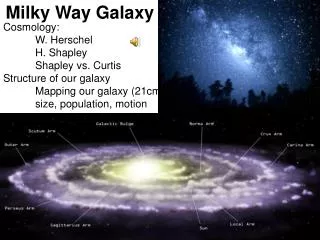
Optical The Milky Way Galaxy is generally considered an Sbc-type galaxy. It has a central bulge of stars and spiral arms of gas and stars in a disk. We view the Milky Way essentially edge-on from our perspective near the plane of the disk and 8.5 kpc (26,000 light years) from the Galactic center. In recent decades, Galactic astronomy has benefited from a tremendous broadening of coverage of the electromagnetic spectrum by ground-based and spaced-based instruments. Presented above are images of the sky near the Galactic plane in spectral lines and continuum bands spanning a frequency range of more than 14 orders of magnitude. The images are derived from several space and ground-based surveys. Each image represents a 360o false color view of the Milky Way within 10o of the plane; the images are in Galactic coordinates with the direction of the Galactic center in the center of each. For scale, the vertical dimension of each image is forty times the angular diameter of the full moon on the sky.
408 MHz Radio Continuum The intensity of radio continuum emission from hot, ionized gas in the Milky Way, from surveys with ground-based radio telescopes (Jodrell Bank MkI and MkIA, Bonn 100 meter, and Parkes 64 meter). At this frequency, most of the emission is from the scattering of free electrons in interstellar plasmas. Near some discrete sources, such as the supernova remnant Cas A near 110 degrees longitude, a significant fraction of the emission also comes from electrons accelerated in strong magnetic fields. The emission from Cas A is so intense that the diffraction pattern of the support legs for the radio receiver on the telescope is visible as a 'cross' shape.
Atomic Hydrogen Column density of atomic hydrogen, derived on the assumption of optically thin emission, from radio surveys of the 21-cm spectral line of hydrogen. On a large scale the 21-cm emission traces the "warm" interstellar medium, which is organized into diffuse clouds of gas and dust that have sizes of up to hundreds of light years. Most of the image is based on the Leiden-Dwingeloo Survey of Galactic Neutral Hydrogen, made available by the authors in advance of publication. This survey was conducted over a period of 4 years using the Dwingeloo 25-m radio telescope.
2.7 GHz Radio Continuum Intensity of radio continuum emission from hot, ionized gas and high-energy electrons in the Milky Way, from surveys with both the Bonn 100 meter, and Parkes 64 meter radio telescopes. Unlike the other views of our Galaxy presented here, these data extend to latitudes of only 5o from the Galactic midplane. The majority of the bright emission seen in the image is from hot, ionized regions, or is produced by energetic electrons moving in magnetic fields. The higher resolution of this image, relative to the 408 MHz picture above, shows Galactic objects in more detail. Note that the bright "ridge" of Galactic radio emission, appearing prominently in the 408 MHz image, has been subtracted here in order to show Galactic features and objects more clearly.
Molecular Hydrogen Column density of molecular hydrogen inferred from the intensity of the J = 1-0 spectral line of carbon monoxide, a standard tracer of the cold, dense parts of the interstellar medium. Such gas is concentrated in the spiral arms in discrete "molecular clouds" and most molecular clouds are sites of star formation. The molecular gas is predominantly H2, but H2 is difficult to detect directly at interstellar conditions and CO, the second most abundant interstellar molecule, is observed as a surrogate. The column densities were derived on the assumption of a constant proportionality between the column density of H2 and the intensity of the CO emission. Black areas in the image indicate regions not yet surveyed for CO.
Infrared Composite mid- and far-infrared intensity observed by the Infrared Astronomical Satellite in 12, 60, and 100 micron wavelength bands. The images are encoded in the blue, green, and red color ranges, respectively. Most of the emission is thermal, from interstellar dust warmed by absorbed starlight, including that in star-forming regions embedded in interstellar clouds. The image here is a mosaic of IRAS Sky Survey Atlas plates; emission from interplanetary dust in the solar system, the zodiacal emission was modeled and subtracted in the production of the Atlas at the Infrared Processing and Analysis Center (IPAC). The black, wedge-shaped areas indicate gaps in the IRAS survey.
Near Infrared Composite near-infrared intensity observed by the Diffuse Infrared Background Experiment (DIRBE) instrument on the Cosmic Background Explorer (COBE) in the 1.25, 2.2, and 3.5 micron wavelength bands. The images are encoded in the blue, green, and red color ranges, respectively. Most of the emission at these wavelengths is from cool, low-mass K stars in the disk and bulge of the Milky Way. Interstellar dust does not strongly obscure emission at these wavelengths; the maps trace emission all the way through the Galaxy, although absorption in the 1.25 micron band is evident in the general direction of the Galactic center.
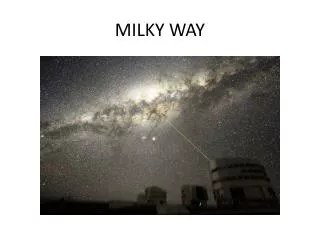
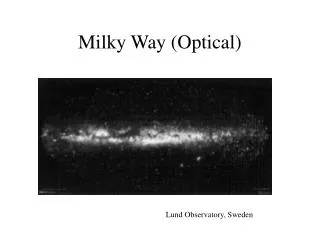
Optical Intensity of visible light from a mosaic of wide-field photographs by Laustsen, Madsen, and West (1987). Owing to the strong obscuration by interstellar dust the light is primarily from stars within a few thousand light-years of the Sun, nearby on the scale of the Milky Way, which has a diameter on the order of 30 kpc (100,000 light years). Nebulosity from hot, low-density gas is widespread in the image. Dark patches are due to absorbing dust clouds, which are evident in the molecular Hydrogen and Infrared maps as emission regions.
X-ray Composite X-ray intensity observed by the Position-Sensitive Proportional Counter (PSPC) instrument on Roentgen Satellite (ROSAT). Images in three broad, soft X-ray bands centered at 0.25, 0.75, and 1.5 keV are encoded in the red, green, and blue color ranges, respectively. In the Milky Way, extended soft X-ray emission is detected from hot, shocked gas. At the lower energies especially, the interstellar medium strongly absorbs X-rays, and cold clouds of interstellar gas are seen as shadows against background X-ray emission. Color variations indicate variations of absorption or of the temperatures of emitting regions. The black regions indicate gaps in the ROSAT survey.
Gamma Ray Intensity of high-energy gamma-ray emission observed by Energetic Gamma-Ray Experiment Telescope (EGRET) instrument on the Compton Gamma-Ray Observatory. The image includes all photons with energies greater than 100 MeV. At these extreme energies, most of the celestial gamma rays originate in collisions of cosmic rays with hydrogen nuclei in interstellar clouds. The bright, compact sources near Galactic longitudes 185o, 195o, and 265o, indicate high-energy phenomena associated with the Crab, Geminga, and Vela pulsars, respectively.