Improving User Interaction with CCP4 Output: Tools for Better Understanding and Communication
The CCP4 output faces challenges as users often overlook detailed information and developers are unaware of available tools. Users desire concise success indicators and actionable next steps, while detailed logs can aid in diagnosing errors. Enhancements like log file markup and collapsible sections in outputs can streamline information delivery. Additionally, a unified graphing program could improve usability, helping users visualize their data more effectively without overwhelming them with complex details. This discussion focuses on optimizing user experience and technical implementation strategies.

Improving User Interaction with CCP4 Output: Tools for Better Understanding and Communication
E N D
Presentation Transcript
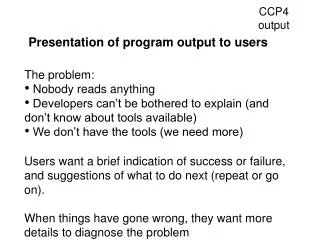
CCP4 output Presentation of program output to users • The problem: • Nobody reads anything • Developers can’t be bothered to explain (and don’t know about tools available) • We don’t have the tools (we need more) Users want a brief indication of success or failure, and suggestions of what to do next (repeat or go on). When things have gone wrong, they want more details to diagnose the problem
CCP4 output What do we have now? • Logfiles with markup, processed with Baubles • For loggraph (& Baubles::JLogGraph) • $Tables • For Baubles: • $TEXT:Result: • $TEXT:Reference: • <!--SUMMARY_BEGIN--> • <!--SUMMARY_END--> • $TEXT:Warning • Others that I don’t know about? Marking-up the logfile keeps (most) everything in one place, as opposed to deriving information from say XML. Mark-up should be minimally obtrusive to reading of plain text. Issues: What should we present to the user & how? What should be the technical implementation?
CCP4 output Graphing output Loggraph is pretty good: now also draws some of the plots from Scala which were aimed at xmgrace Probably good enough: could simplify the syntax to eliminate the peculiar xmgrace commands loggraph These are plotted from separate files since they have too many points to go in the logfile xmgrace
CCP4 output Baubles generates graphs using a Java applet (JLogGraph) written by Kevin Is there a case for having a single graphing program? JLogGraph could be run stand-alone as well as a plug-in, but currently lacks some of the features of loggraph (editing of styles, printing, xmgrace emulation, etc): further developments are possible Loggraph depends on blt, which is a cause of some grief in installation. Is Java a safer long-term dependency than TCL/Tk/blt? Java is not without its problems: not always available
CCP4 output I would like a similar smart scheme to plot against batch number, allowing for breaks A Good Thing about tailored plotting tools is that loggraph can plot against resolution in Å
CCP4 output What else do we need? For complicated logfiles, eg from Scala, we need something between the Result or Summary and the full logfile, so that if there are problems the user can drill down the hierarchy to the details. One model is the Sharp output, but that is implemented by a blizzard of html files, which is perhaps undesirable (a typical Sharp run generates a directory of >100 files). A suggestion: collapsible sections. How can this be implemented?
Rcum :- R-merge up to this range, Ranom :- Sum |Mn(I+) - Mn(I-)| / Sum (Mn(I+) + Mn(I-)) Rfull :- R-merge for fulls only, Nref :- number of independent hkl's SIGMA :- rms scatter of observations sd :- average standard deviation derived from experimental SDs, after :- application of SDFAC SDADD FRCBIAS :- Mean( Mn(If) - Ip )/Mean( Mn(I) ) for Nbias mixed sets only (If is a full if present, else the partial with the smallest number of parts) Agreement by resolution Explanation Agreement by resolution Agreement by resolution Plot graph Explanation By 4SINTH/LASQ bins (all statistics use Mn(I+),Mn(I-)etc) ______________________________________________________________ N 1/d^2 Dmin(A) Rmrg Rfull Rcum Ranom Nanom Av_I SIGMA I/sigma sd Mn(I/sd) Nmeas Nref Ncent FRCBIAS Nbias $$ 1 0.0313 5.65 0.028 - 0.028 0.051 257 57520 4457 12.9 2329 37.8 1306 369 120 -0.018 291 2 0.0625 4.00 0.021 0.039 0.023 0.029 549 112588 4065 27.7 5466 36.2 2584 687 159 -0.017 590 3 0.0938 3.26 0.029 0.035 0.025 0.031 744 81634 4162 19.6 4642 30.1 3382 868 159 -0.019 862 4 0.1251 2.83 0.029 0.052 0.026 0.040 892 36249 1780 20.4 2610 22.7 3939 995 158 0.001 961 5 0.1564 2.53 0.037 0.019 0.027 0.049 1025 20742 1194 17.4 1875 17.8 4399 1110 159 -0.006 1084 6 0.1876 2.31 0.052 - 0.029 0.059 1138 13476 1062 12.7 1523 14.4 4796 1196 148 0.000 1299 7 0.2189 2.14 0.075 - 0.031 0.072 1227 9597 1206 8.0 1329 11.9 5062 1277 154 0.031 1350 8 0.2502 2.00 0.102 - 0.034 0.083 1313 6973 1033 6.8 1228 9.4 5225 1325 142 0.009 1492 9 0.2814 1.88 0.152 - 0.036 0.122 1367 4254 942 4.5 1045 6.8 5253 1332 127 0.000 1436 10 0.3127 1.79 0.241 - 0.038 0.176 1263 2162 735 2.9 853 4.3 4861 1237 105 -0.027 1318 $$ For inline graphs use a Java browser Overall: 0.038 0.035 0.038 0.045 9775 25943 2051 12.7 1997 15.6 40807 10396 1431 -0.009 10683 Rmrg Rfull Rcum Ranom Nanom Av_I SIGMA I/sigma sd Mn(I/sd) Nmeas Nref Ncent FRCBIAS Nbias By 4SINTH/LASQ bins (all statistics use Mn(I+),Mn(I-)etc) ______________________________________________________________ N 1/d^2 Dmin(A) Rmrg Rfull Rcum Ranom Nanom Av_I SIGMA I/sigma sd Mn(I/sd) Nmeas Nref Ncent FRCBIAS Nbias $$ 1 0.0313 5.65 0.028 - 0.028 0.051 257 57520 4457 12.9 2329 37.8 1306 369 120 -0.018 291 2 0.0625 4.00 0.021 0.039 0.023 0.029 549 112588 4065 27.7 5466 36.2 2584 687 159 -0.017 590 3 0.0938 3.26 0.029 0.035 0.025 0.031 744 81634 4162 19.6 4642 30.1 3382 868 159 -0.019 862 4 0.1251 2.83 0.029 0.052 0.026 0.040 892 36249 1780 20.4 2610 22.7 3939 995 158 0.001 961 5 0.1564 2.53 0.037 0.019 0.027 0.049 1025 20742 1194 17.4 1875 17.8 4399 1110 159 -0.006 1084 6 0.1876 2.31 0.052 - 0.029 0.059 1138 13476 1062 12.7 1523 14.4 4796 1196 148 0.000 1299 7 0.2189 2.14 0.075 - 0.031 0.072 1227 9597 1206 8.0 1329 11.9 5062 1277 154 0.031 1350 8 0.2502 2.00 0.102 - 0.034 0.083 1313 6973 1033 6.8 1228 9.4 5225 1325 142 0.009 1492 9 0.2814 1.88 0.152 - 0.036 0.122 1367 4254 942 4.5 1045 6.8 5253 1332 127 0.000 1436 10 0.3127 1.79 0.241 - 0.038 0.176 1263 2162 735 2.9 853 4.3 4861 1237 105 -0.027 1318 $$ For inline graphs use a Java browser Overall: 0.038 0.035 0.038 0.045 9775 25943 2051 12.7 1997 15.6 40807 10396 1431 -0.009 10683 Rmrg Rfull Rcum Ranom Nanom Av_I SIGMA I/sigma sd Mn(I/sd) Nmeas Nref Ncent FRCBIAS Nbias CCP4 output Mock up of what it might look like
CCP4 output Other things: links to documentation etc Results tables (“magic tables”) maybe need to be a bit more flexible || specified eg non-numeric items We need some extra mark-up tags Designing the best presentation of results needs testing with users: there are many questions How best to present to the user what to do next?