Download
1 / 24
240 likes | 264 Vues
Explore how climate change impacts disease transmission via vectors, using GIS technology for prediction and control. Case studies highlight mapping challenges and vector management strategies. Learn about the intersection of climate, vectors, and disease.

E N D
THE RELATIONSHIP BETWEEN THE CLIMATE, THE VECTOR AND THE DISEASE Erasmus Mundus Conference – Higher Education and Climate Change 26-27 February 2009 Central European University, Budapest, Hungary Prepared by: Shamsul Ridzuan IDRIS Program for Spatial and Urban Management National Institute of Public Administration MALAYSIA
OUTLINE • INTRODUCTION • THE CLIMATE, THE VECTOR & THE DISEASE • USING GIS AND RS IN PREDICTING AEDES INCIDENCES AND CONTROL THE VECTOR • MAPS PREDICT PLACES WITH RISK OF DENGUE • PROBLEMS IN MAPPING THE VECTOR • SUMMARY
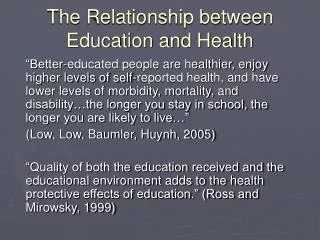
INTRODUCTIONEstimating the Effects of Climate Change on Health Pathway through which climate change may affect health Source: Adapted from Patz et al. (2000)
Our CLIMATE is changing West Nile Virus Incidences in United States in 2007 Map produced by USGS: http://diseasemaps.usgs.gov/
Continue… GIS to fight dengue epidemic in Bangkok 30 August 2007 Bangkok, Thailand, August 28, 2007: Authorities in Bangkok are resorting to a GIS to ease the dengue epidemic in the Thai capital. Bangkok governor Apirak Kosayodhin said, a longer rainy season and changing temperatures have favored the breeding of the mosquito that transmit the fatal disease. Since Jan. 1, there were 3,089 cases of dengue in Bangkok, four of which were fatal. The governor added the GIS will help the city officials to find critical epidemic areas and allow them to refine their focus in fighting the infections.
Continue… Climate Change Observation - Malaysia • Highest temperature 40.1° C (Apr 1998) • Highest rainfall 159.4 mm/hour (Oct 2006) • Big flood incidences Dec 2004, Dec 2005, Apr 2006. May 2006, Dec 2006, Jan 2007, Apr 2008. Aug 2008, Sept 2008 • Occurrence of El-Niño (1997/98), La Niña (2007,2009)
Malaysia’s CLIMATE is changing Increase temperature and rainfall in Malaysia Source from Meteorological Dept. Malaysia
THE VECTOR • Mapping using GIS and Remote Sensing can differentiate incidences according to species of mosquito, breeding grounds and type of disease • Species of interest • Culex – Malaria/WNV/JE • Aedes – Dengue/Chikungunya • Anopheles - Malaria
Common communicable diseases sensitive to climate Climate is the primary factor in epidemic • Cholera, Malaria Climate plays significant role • Meningococcal meningitis, leishmaniasis, dengue, Japanese encephalitis, Rift valley fever, Ross river virus, St. Louis encephalitis, Murray valley fever Source from WHO, (2004)
THE DISEASE Increase incidences of vector diseases Reduce in reported Malaria cases Increase in reported Dengue fever Source: Adapted from Ishak R., 2007
Continue… Source: Ministry of Health, Malaysia
Malaria in Year 2100 Source: Adapted from Ishak R., 2007
Dengue Fever in Year 2100 Source: Adapted from Ishak R., 2007
USING GIS AND RS IN PREDICTING AEDES INCIDENCES AND CONTROL THE VECTOR • To understand that disease surveillance and mapping of potential risk area can be addressed by GIS and RS technologies • To track mosquito and larval density in specific zones and predict disease patterns • To link and update information on the environment, weather condition and disease incidences • To facilitate health authority to undertake specific measures to reduce and control the vector
MAPS PREDICT PLACES WITH RISK OF DENGUE • Dengue Risk Map with different categories of risk • Mapping produced on smaller residential area (Subang Jaya) • To identify the area where a dengue outbreak is going to occur (prevention) • Mitigation measure - vector control Dengue Risk Map prepared in Umor et al. (2007)
Continue… Dengue Risk Map Methodology Concept Source: Adapted from Umor et al. 2007
Continue… • Dengue Risk Map with the point case location of recorded dengue incidences Source: Adapted from Umor et al. 2007
PROBLEMS IN MAPPING THE VECTOR • Stagnant water/water bodies in small stream/ditches/drainage system under a tree canopy will be difficult to detect using RS. These are important habitats for early stages of mosquito life. It is mostly located near to residential areas and human population. • The collection of data on mosquito breeding ground is labour intensive and need to be properly geo-referenced
Continue… • Mosquito breeding in freshwater wetlands can be a complex problem and must be considered on a case by case basis. • Mosquito management in such sites should aim to minimize population numbers, or reduce them to a tolerable or nonthreatening level. However, different species, various types of habitat and a range of environmental conditions will have to be addressed • Despite the availability of chemical insecticide, Larvivorous fish are more practical for use in wetlands as Biological Agent
SUMMARY • Previous study revealed that environmental changes have a major contribution to the pattern of disease incidences and distribution • Adaptations to climate change (autonomous or planned responses that reduce the vulnerability of populations to the consequences of climate change) are often not addressed • Little effort has previously been directed to describing and understanding the geographical variations in likely impacts Source: Adapted from McMichael et al. (2003)
SUMMARY Continue… • Climate variability in Malaysia is very much influenced by the monsoon (intra-seasonal/inter-annual) and ENSO (Tangang et al. (2007)) • Consistent with other places, generally temperature in Malaysia is rising and long-term trend of precipitation are more variable • If ocean warming affect the monsoon system, characteristics of climate variability in Malaysia will be affected • How global warming alter local rainfall distribution, disease and vector outbreak need further investigation
THANK YOU sridzuan74@yahoo.com
REFERENCES: • Malaysian Remote Sensing Agency http://www.remotesensing.gov.my/ • Malaysia Meteorological Department http://www.met.gov.my • Ministry of Health http://www.moh.gov.my/MohPortal/ • Hassan, Kumar & Kumarenthiran, 2008, “Climate Change Scenario and the Impact of Global Warming on the Winter Monsoon”, paper presented at the Second National Conference on Extreme Weather and Climate Change Understanding Science and Risk Reduction, 14-15 Oct 2008, Putrajaya, from http://www.met.gov.my/ClimateChange2008/ • Ishak, R., 2007, “Health Effect of Climatic Change: Malaysian Scenarios”, paper presented at National Seminar on Socio-economic Impacts of Extreme Weather and Climate Change, 21-22 June 2007, Putrajaya, from http://www.met.gov.my/ClimateChange2007/ • McMicheal et al., 2003, “Global Climate Change, Chap 20, Comparative Quantification of Health Risk”, from www.who.int/publications/cra/chapters/volume2/1543-1650.pdf • Tangang et al, 2007, “Climate variability, climate change and Extreme Weather Events in Malaysia”, paper presented at National Seminar on Socio-economic Impacts of Extreme Weather and Climate Change, 21-22 June 2007, Putrajaya, from http://www.met.gov.my/ClimateChange2007/
REFERENCES: Umor, S.M., Mokhtar, M, Surip, N and Ahmad, A, 2007, “Generating a Dengue Risk Map (DRM) Based on Environmental Factors using Remote Sensing and GIS Technology”, paper presented at Conference of the Asian Association of Remote Sensing, 12-16 November 2007, PWTC, Malaysia. Malaysian Meteorological Department, 2006: Report on heavy rainfall that caused floods in Johor, Melaka, Negeri Sembilan and Pahang during the period 17th -20th December 2006. Malaysian Meteorological Department, 2007: Report on the second heavy rainfall episode that caused floods in Johor and southern Pahang during the period 11th -14th January 2007.