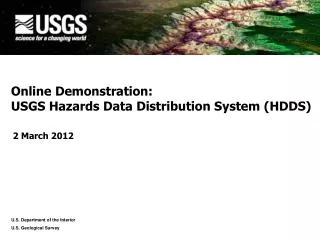
USGS Hazards Information
USGS Hazards Information. Brian McCallum, USGS GA Water Science Center OFCM Exploratory Mini-Workshop May 3, 2010. Overview. USGS Overview Water Hazards Information Flood/drought activities NWISWeb WaterWatch Streamail WaterAlert Flood Inundation Mapping USGS on social media Summary.

USGS Hazards Information
E N D
Presentation Transcript
USGS Hazards Information Brian McCallum, USGS GA Water Science Center OFCM Exploratory Mini-Workshop May 3, 2010
Overview • USGS Overview • Water Hazards Information • Flood/drought activities • NWISWeb • WaterWatch • Streamail • WaterAlert • Flood Inundation Mapping • USGS on social media • Summary
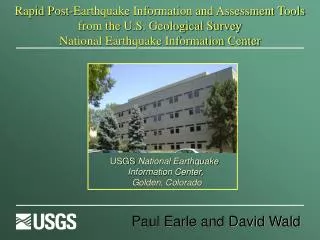
USGS Overview • Federal agency in DOI • Headquarters in Reston—offices in every state • Four disciplines: Water, Geology, Mapping, Biology WATER • Collected water data since the 1890’s • USGS Cooperative Water and National Streamflow Information Program • Very strong programs with USACE, FERC, state and local governments • Strong QA/QC of data and prodcuts
USGS Overview Priority Water Science Issues • Understanding Ecosystems • Climate Variability & Change • Energy & Minerals for America’s Future • A National Hazards, Risk, and Resilience Assessment Program • Role of Environment & Wildlife in Human Health • A Water Census of the United States Facing Tomorrow’s Challenges, USGS Science in the Decade 2007—2017, Circular 1309
Water Hazards Information Flood & Drought Activities Real-Time Data Networks • 9329 surface-water stations • 386 lake & reservoir stations • 3635 raingage stations • 1353 groundwater wells • 1742 continuous water-quality Effort underway to upgrade entire network to hourly transmissions
Water Hazards Information Housing with raingage Pressure orifice line buried Outside gage (staff)
Water Hazards Information Why is a streamgage important? • Flood warning/forecasting • Flood control • Hurricane surge • Drought monitoring • State Water Planning • Water wars • Water supplies for continued growth • Water effluent discharges • Hydro-electric power generation • Navigation • Safe bridge and roadway design • Recreation • Tourism • Long-term climate analyses • Modeling Allatoona Dam
Water Hazards Information USGS personnel must go into the storm to accurately measure flood waters to verify streamflow ratings. This allows the NWS to better forecast expected flood crests, which in turn informs emergency managers to save lives and property.
Water Hazards Information Tuesday, Sept. 22st USGS crews measuring Sweetwater Creek near Austell, Georgia …in a boat on I-20!
Water Hazards Information Monday, Sept. 21st Chattahoochee at Morgan Falls Dam near Roswell, Georgia Tuesday, Sept. 22st USGS hydrographer preparing to measure by boat
Water Hazards Information Monday, Sept. 21st USGS Hydrographer inspects flooded car for emergency officials at Peachtree Creek at Atlanta (Northside Drive) (courtesy AJC)
Water Hazards Information Dog River at GA 5 near Fairplay Water was 12 feet above the gage house
Water Hazards Information Indirect measurements are surveyed to determine peak flow estimates during large floods High-water marks are used to verify high ends of ratings and extend ratings only by short segments
Water Hazards Information Flood measurements allow for creation of regression curves that determine flood magnitudes. These are used for future design of bridges, culverts, roadways, water systems and more. The lives of every citizen in the US is impacted by USGS streamflow data. *Results are provisional and subject to change upon further review
Water Hazards Information—NWISWeb • All real-time data collected by USGS • All historical data • All daily, monthly, annual statistics • All field measurements • All peak flows
Water Hazards Information—WaterWatchhttp://waterwatch.usgs.gov
Water Hazards Information—WaterWatchhttp://waterwatch.usgs.gov
Water Hazards Information—WaterWatchhttp://waterwatch.usgs.gov
Water Hazards Information • Streamail • Water data on request to your cell phone/email. • Send email to streamail@usgs.gov and in the subject line put the USGS station number, like “02336300” • Get a reply: • The latest river stage and streamflow values you requested from StreaMail. • Site: 02336300Station name: PEACHTREE CREEK AT ATLANTA, GADate: 09/30/2009Time: 09:00:00Stage: 2.95 feetStreamflow: 90 cubic feet per second (cfs) • Link to charts for 02336300:Stage: http://waterwatch.usgs.gov/wwapps/zchart.php?i=nwis2&&vt=uv&&cd=00065&site_no=02336300Streamflow: http://waterwatch.usgs.gov/wwapps/zchart.php?i=nwis2&&vt=uv&&cd=00060&&site_no=02336000
Water Hazards Information USGS WaterAlert Sends emails/texts based upon user pre-set thresholds All real-time parameters Hourly or daily intervals Thresholds: greater than less than between a range outside a range Courtesy AJC
Water Hazards Information Flood Inundation Mapping Take the hydrograph (and NWS forecast) and convert it into a GIS coverage with meta data Water depths over emergency routes, affected populations, impacted economic interests, reverse-911 systems
USGS social networking Twitter YouTube Facebook Flickr Pageflakes Netvibes RSS Podcasts
Water Hazards Information Issues • Still a ways to go to better communicate flood threat • Sheer magnitude of flood fight precluded communications • Still some misunderstanding of how real-time data is presented • Need a better way to explain post-storm estimates of probability • Limits of 0.2 percent chance of exceedence (500-year) flood don’t allow for proper presentation of size of event • Have to resort to “If a flood were a cup of coffee…”
Summary The role of the USGS in events like this sometimes goes unnoticed, but is a vital one USGS is being proactive in not only passive, but active, data access with WaterWatch, WaterAlert, and Streamail Social networking is on the near horizon for data delivery Still have issues to reconcile with how to easily portray highly scientific data
Questions…? Brian McCallum bemccall@usgs.gov (770) 903-9127