Download
1 / 117

E N D
Energy and the Global EconomyGordon J. Aubrecht, IIauthor of Energy: Physical, Environmental, and Social Impact (Prentice Hall, 2006)http://vig.prenhall.com/catalog/academic/product/0,1144,0130932221,00.htmlPhysics Education Research GroupOhio State University Marion CampusTalk presented at Great Decisions, 6 March 2009
Abstract: The Fourth Assessment Report of the IPCC was released in 2007 and dealt with the scientific basis for climate change, consequences of emissions, and mitigation and adaptation. The cost of oil (in constant dollars), and the gasoline made from it, was higher through the first half of 2008 than at any time in history before declining with the global economic downturn. In response, for the first time in decades, Americans drove less. For the first time, a majority of Americans polled understand that global warming will lead to significant change in climate. How will these changes affect future actions of citizens of North America and the world? What can be done to protect the future of our children and grandchildren? This talk will focus on human effects on Earth and their import for the future of the global economy.
All of us live on this precious jewel of a planet. How many of us have not been moved to see the photographs of Earth from space?But now there are more than 6.5 billion of us here, and nearly half must live on under $2 a day.The poorest people live in a world shaped by the rich countries.
In yesterday’s Delaware Gazette, there was a letter to the editor from Mr. Rob Kessler entititled “‘Smart’ drivers are fooling themselves.”Among other things he said was “What a bunch of hogwash! I am so tired of hearing about man’s effect on so-called global warming and climate change. We couldn’t alter the climate even if we tried. The truth is, Mother Nature does more to harm the environment and climate than Man could ever possibly do. Do you actually know how much garbage is spewed into the air when a volcano erupts or how much methane gas is emitted because of cow flatulence? What utter hubris it is to think that man has the ability to alter the awesome forces of nature!”
Actually, yes, Mr. Kessler. Humanity does have the ability to alter the environment. It seems likely that humans have been affecting the environment for over five thousand years.Let’s take the statement about cow flatulence, indeed a big source of methane emissions. Why is this a problem? Well, there are now about 1.5 billion cows in the world. How many cow ancestors were there prior to domestication some 5 to 10 thousand years ago? Clearly, not that many! Who is responsible, Mr. Kessler, for this large a number? We are. And cows release almost one-fifth of the world’s greenhouse gases, mostly through belching (but also through flatulence). Total methane emission is 53.9 Mte/yr.
How many were there before humans domesticated cattle? We can’t know, but in sub-Saharan Africa, there are roughly 100,000 hippos. Because there was probably about five to ten times as much land suitable for grazing herbivores in the world, we can guess that the ancestral cattle population was perhaps 500,000 to 1 million. That’s one-fifteen-hundredths of the number of cattle today. Humans have made a pretty big difference. If we add sheep, goats, pigs, and other domesticated animals, the amount of methane generated per year by animal husbandry increases to about 80 Mte.
Humans in large numbers are fishing the oceans barren. Anyone who looks at the data can see that 6.5 billion humans do indeed affect Mother Nature. Even humans in small numbers do have effects on climate. Ruddiman has shown that the difference between this interglacial and the preceding three (all driven by the same Milankovich parameters) began around 7500 years ago. This is the time when domestication was taking place, when trees were being felled for arable land, when rice (a prodigious methane emitter) was being domesticated.
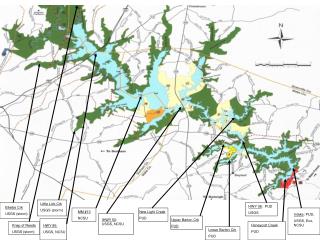
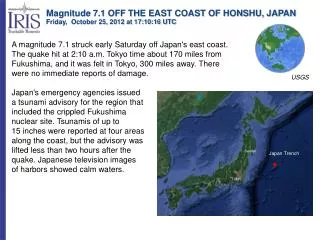
Volcanic emissions certainly affect Earth. No one doubts that. Mt. Pinatubo lowered the world’s temperature by 0.5 °C in 1992 by virtue of the 25-30 million tonnes of SO2 it put into the atmosphere, the most massive sulfate aerosol cloud since the Krakatoa eruption of 1883 (which put over 20 km3 of dust into the stratosphere). This sulfate aerosol and stratospheric dust cools Earth. USGS
Volcanic emissions include CO2. Volcanic activity releases about 130 to 230 Mte/yr of CO2, a large amount of course. However, Mr. Kessler, humans currently release over 8 Gte/yr—over 35 times as much.
So, I’m going to show you why humans are implicated in global warming in addition to talking about energy and the economy.The best source of material is the Intergovernmental Panel on Climate Change (IPCC), run by the UN and the WMO (World Meterological Organisation).
Many of you have heard of the IPCC. For those of you who have not, it is run by the UN and the WMO and is made up of scientific experts who comb through what is known in the scientific literature and summarize the findings. Diversity of views is solicited. About one-third of the scientists in the first assessment participated in the second, about one-third who were in the second participated in the third, and so on. Governments (180 members) vote line by line on the Summaries for Policymakers.(You may have heard of the resistance of the US and China to these reports in 2007, which reports do reflect their objections.)
Here is an extremely condensed summary of the results of the four assessments to date:1990 First Assessment Report“The unequivocal detection of the enhanced greenhouse effect from observations is not likely for a decade or more.”1995 Second Assessment Report“The balance of evidence suggests a discernable human influence on global climate.”2001 Third Assessment Report“There is new and stronger evidence that most of the warming observed over the last 50 years is attributable to human activities.”2007 Fourth Assessment Report“Most of the observed increase in globally averaged temperatures since the mid-20th century is very likely due to the observed increase in anthropogenic greenhouse gas concentrations.”
Terminology used by IPCCLikelihood of the occurrence / outcomeVirtually certain >99% probability Very likely 90 to 99% probabilityLikely 66 to 90% probabilityAbout as likely as not 33 to 66% probabilityUnlikely 10 to 33% probabilityVery unlikely 1 to 10% probabilityExceptionally unlikely <1% probability
Let me repeat the last statement from the 2007 Fourth Assessment Report, which may not have looked very impressive when you saw it:“Most of the observed increase in globally averaged temperatures since the mid-20th century is very likely due to the observed increase in anthropogenic greenhouse gas concentrations.”Very likelymeansa 90 to 99% probability! IPCC was not kidding around about this.
The IPCC report actually comes from amalgamation of results from three separate Working Groups: the scientific basis (WG1); impacts, adaptation, and vulnerability (WG2); and mitigation of climate change (WG3).
Why CO2 is implicated …Humans began to affect the world when people began to clear land and grow crops around 8000 years ago. Then the industrial revolution involved fossil fuel burning on an unprecedented scale.
How human CO2 is implicated Photosynthesis — on land or in the sea — always takes more of the lower-mass carbon (carbon-12) from the mix of available CO2. So carbon fixed by plants will always have a 13C value less than that of the source CO2.
“Defining what is dangerous anthropogenic interferencewith the climate system and, consequently, the limits to beset for policy purposes are complex tasks that can only bepartially based on science, as such definitions inherentlyinvolve normative judgments.”—IPCC Working Group 3
Table 1. A simple typology of uncertaintiesType UnpredictabilityIndicative examples of sources Projections of human behaviour not easily amenable to prediction (e.g., evolution of political systems).Chaotic components of complex systems.Typical approaches or considerationsUse of scenarios spanning a plausible range, clearly stating assumptions, limits considered, and subjective judgments.Ranges from ensembles of model runs.
Table 1. A simple typology of uncertaintiesType Structural uncertaintyIndicative examples of sources Inadequate models, incomplete or competing conceptual frameworks, lackof agreement on model structure, ambiguous system boundaries or definitions, significant processes or relationships wrongly specified or not considered.Typical approaches or considerationsSpecify assumptions and system definitions clearly, compare models with observations for a range of conditions, assess maturity of the underlying science and degree to which understanding is based on fundamental concepts tested in other areas.
Table 1. A simple typology of uncertaintiesType Value uncertaintyIndicative examples of sources Missing, inaccurate or non-representative data, inappropriate spatial or temporalresolution, poorly known or changing model parameters.Typical approaches or considerationsAnalysis of statistical properties of sets of values (observations, model ensembleresults, etc); bootstrap and hierarchical statistical tests; comparison of models with observations.
This Tony Auth cartoon (published in The Philadelphia Inquirer on April 10, 2007) gives a slightly scary view of the IPCC Fourth Assessment Report
IPCC Working Group 1 says:The global atmospheric nitrous oxide concentration increased from a pre-industrial value of about 270 ppb to 319 ppb in 2005. The growth rate has been approximately constant since 1980. More than a third of all nitrous oxide emissions are anthropogenic and are primarily due to agriculture.The combined radiative forcing due to increases in carbon dioxide, methane, and nitrous oxide is +2.30 [+2.07 to +2.53] W m–2, and its rate of increase during the industrial era is very likely to have been unprecedented in more than 10,000 years.
IPCC Working Group 1 says:“Warming of the climate system is unequivocal, as is now evident from observations of increases in global average air and ocean temperatures, widespread melting of snow and ice, and rising global average sea level.”
IPCC Working Group 1 says:“At continental, regional and ocean basin scales, numerous long-term changes in climate have been observed. These include changes in arctic temperatures and ice, widespread changes in precipitation amounts, ocean salinity, wind patterns and aspects of extreme weather including droughts, heavy precipitation, heat waves and the intensity of tropical cyclones.” “Palaeoclimatic information supports the interpretation that the warmth of the last half century is unusual in at least the previous 1,300 years. The last time the polar regions were significantly warmer than present for an extended period (about 125,000 years ago), reductions in polar ice volume led to 4 to 6 m of sea level rise.”
IPCC Working Group 1 says:“Most of the observed increase in global average temperatures since the mid-20th century is very likely due to the observed increase in anthropogenic greenhouse gas concentrations. This is an advance since the TAR’s conclusion that ‘most of the observed warming over the last 50 years is likely to have been due to the increase in greenhouse gas concentrations’. Discernible human influences now extend to other aspects of climate, including ocean warming, continental-average temperatures, temperature extremes and wind patterns.” “For the next two decades, a warming of about 0.2 °C per decade is projected for a range of SRES emission scenarios. Even if the concentrations of all greenhouse gases and aerosols had been kept constant at year 2000 levels, a further warming of about 0.1 °C per decade would be expected.” “There is now higher confidence in projected patterns of warming and other regional-scale features, including changes in wind patterns, precipitation and some aspects of extremes and of ice.”
Note the blue. It shows the effect of natural emissions.The IPCC does NOT ignore natural causes as Mr. Kessler and others suggest.
Observedtemporal changes in animals and plants with changes over the same timeperiods in observed temperatures as well as modeled temperatures using (i) onlynatural climate forcing; (ii) only anthropogenic climate forcing; and (iii) bothforcings combined.Neither works well by itself—both are needed.
IPCC Working Group 1 says:“Both past and future anthropogenic carbon dioxide emissions will continue to contribute to warming and sea level rise for more than a millennium, due to the time scales required for removal of this gas from the atmosphere.”If T ~ 1.5 °C - 2.5 °C, 20% to 30% of plants and animals at high risk of extinction. IPCC Working Group 2 says:Temperature changes in 5° by 5° cells that cover the globe, 2001-2006. The expected random result is in gray (curve). Blue shows cooling. Red shows warming.
United States annual temperature--the 25 warmest years (°C)Note that 9 of the warmest 25 years are from the past decade (red). The missing year is 2008, which was the 39th warmest in the 114 years of US temperature history at 11.68 °C (ahead of, for example, 1997 at 40th).One would expect that smaller landmasses would exhibit more variation than the globe.
Let’s look at the global temperature.What is the chance that so many of the last 25 warmest years (in red) were among the last 25 years?Not very large!