Download
1 / 35
350 likes | 547 Vues
Corruption Perception Index VS Unemployment Rate. Li Wing 06000525 Cheung Wai Yin 06011624 Kwan Nga Lee 06015387 Leung Man Chun 06009476 Ho Kwong Yin 06008771. Corruption Perceptions Index (CPI).

E N D
Corruption Perception Index VS Unemployment Rate Li Wing 06000525 Cheung Wai Yin 06011624 Kwan Nga Lee 06015387 Leung Man Chun 06009476 Ho Kwong Yin 06008771
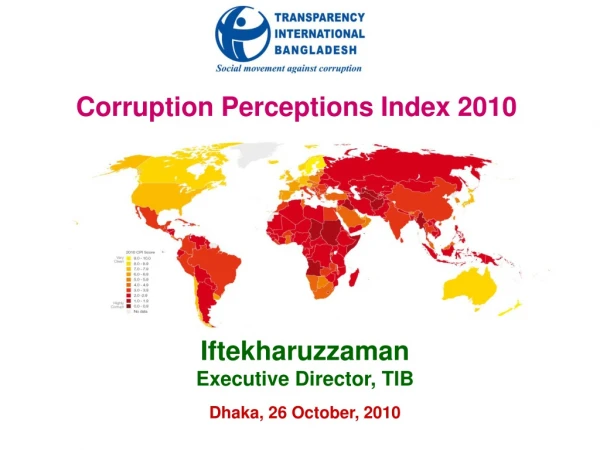
Corruption Perceptions Index (CPI) • The annual Corruption Perceptions Index (CPI), first released in 1995, is the best known of Transparency International(TI)’s tools. • It has been widely credited with putting TI and the issue of corruption on the international policy agenda. • The CPI ranks 180 countries by their perceived levels of corruption, as determined by expert assessments and opinion surveys.
Corruption Perceptions Index (CPI) • Definition of CPI and corruption • CPI ranks countries in terms of the degree to which corruption is perceived to exist among public officials and politicians. • It is a composite index, a poll of polls, drawing on corruption-related data from expert and business surveys carried out by a variety of independent and reputable institutions. • Corruption is defined as the abuse of public office for private gain.
Corruption Perceptions Index (CPI) • CPI based on perceptions because it is difficult to assess the overall levels of corruption in different countries based on hard empirical data. • The 2007 CPI ranks 180 countries. • The 2006 CPI included 163 countries. • New countries are included in the 2007 CPI are Montenegro, Afghanistan, etc. • The countries might be included in future CPIs are Turks, Cook Islands, Marshall Island, etc.
The Source of Data • The 2007 CPI draws on 14 different polls. • The 2007 CPI surveys from 12 independent institutions. • All sources must provide a ranking of nations and measure the overall extent of corruption. • Resident and non resident are polled for the surveys used in the CPI.
Interpreting the CPI • CPI is interpreted as a ranking of countries with scores ranging from 0 (highly corrupt) to 10 (highly clean). • The score is the indication of the perceived level of corruption in a country. • The country with lowest score is the one where corruption is perceived to be greatest among those included in the list.
Interpreting the CPI • Comparisons with previous year CPI should be based on a country’s score, not its rank. • CPI is hard to improve over a short time period. • There is not a greater change in a particular country’s score.
Change in score between 2006 and 2007 • Countries with the most deteriorated scores are Austria, Macao, Thailand, etc. • Countries whose score improved most are Cuba, Italy, Romania, South Africa, etc.
Using CPI • If a country is believed to be corrupt, this serve as a warning signal to donors. • Donors should pay particular attention and make sure to set up the appropriate control processes. • Systemic approaches is needed to fight corruption.
Using CPI • The reliability of the CPI differs across countries. • Countries with high number of sources and small differences in the evaluations provided by the sources convey greater reliability in terms of their score and ranking.
How is the CPI funded? • Transparency International is funded by various government agencies, international foundations and corporations, whose financial support makes the CPI possible → independence can be maintained.
Sources • Sources Evaluation of the extent of corruption By country experts, non resident and residents ADB, AFDB, BTI, CPIA, EIU, FH, MIG, UNECA and GI By resident business leaders IMD, PERC, and WEF
Criteria • Corruption, conflicts of interest, diversion of funds as well as anticorruption efforts and achievements Asian Development Bank (ADB), African Development Bank (AFDB) and the World Bank (CPIA) • The misuse of public office for private (or political party) gain Economist Intelligence Unit (EIU) • Extent of corruption as practiced in governments, as perceived by the public and as reported in the media, as well as the implementation of anticorruption initiatives IMD Freedom House (FH) • Corruption in their definition ranges from bribery of government ministers to inducements payable to the “humblest clerk” Merchant International Group (MIG)
Criteria • How serious do you consider the problem of corruption to be in the public sector? Political & Economic Risk Consultancy (PERC) • “Corruption Control”. This includes aspects related to corruption in the legislature, judiciary, and at the executive level, as well as in tax collection. Aspects of access to justice and government services are also involved United Nations Economic Commission for Africa (UNECA) • Undocumented extra payments or bribes connected with various government functions • World Economic Forum (WEF) • The likelihood of encountering corrupt officials, ranging from petty bureaucratic corruption to grand political corruption Global Insight (GI)
The Methodology of the CPI • Step 1 standardization determine mean value for a country via matching percentiles technique useful for combining sources that have a different distribution some information inherent in the sources loss remain within the bounds of the CPI between 0 and 10
The Methodology of the CPI • Step 2 A beta-transformation A second standardization avoid a continuous trend to less diversity among scores increases the standard deviation avoids smaller standard deviation ensures that the high-low range is consistently related to a country’s mean value
The Methodology of the CPI • Step 3 values for a country are averaged determine a country's score • Step 4 determined by a bootstrap methodology 90% confidence range 5% probability value is below and above this confidence range
The Methodology of the CPI • The accuracy of the confidence interval estimates increases with a growing number of sources • reliability of data is demonstrated in the high correlation between sources
Regression Result Using E-views to run a regression, we get the following result:
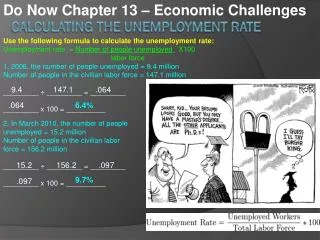
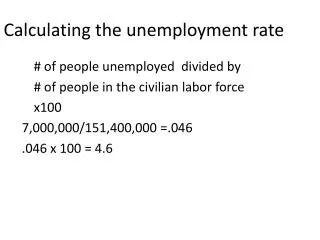
Regression Results • Unemployment = 13.5417 – 1.0305 CPI • s.e. (2.0360) (0.3768) • R-squared = 0.07594, N=93, SER=8.3409 • When Corruption Perception Index equals to zero, the Unemployment rate of a country will be 13.5417% • When Corruption Perception Index increases by 1 unit, the unemployment rate will decrease by 1.0305%
Regression Results • R-squared = 0.07594 • This means that only 7.594% of the total variation of unemployment rate can be explained by the variation of the CPI
Regression Result From the regression result, we can see that: • We can say that the regression result is 5% significant, since the p-value is smaller than 0.05
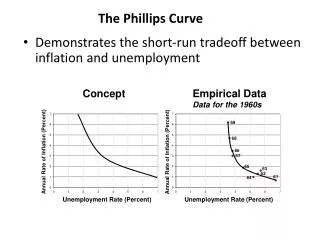
Relationship between CPI and unemployment rate CPI↑( less corruption) → ↑certainty, fair → ↑confidence in investing → ↑investment → ↑labour demand → ↓unemployment rate
Limitation • subjective • Since everyone has different perceptions towards corruptions, the composite index CPI is a subjective idea.
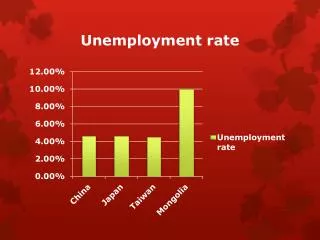
Case study : China and HK Abnormal case: China • low CPI and low unemployment rate • CPI: 3.5 (ranking 72) • unemployment: 4% Why? • relatively low production cost • a huge potential market (for consumer goods) • Corruption? Grey market? →in the long run, such competitive advantages↓
Case study : China and HK Hong Kong • high CPI and low unemployment • CPI: 8.3 (ranking 14) • unemployment rate: 4.2% Why? • Well-established anti-corruption system (ICAC) • free market • low tax rate system
Case study : China and HK Then, what lesson can China learn from Hong Kong? • Low tax rate system • Build up a more incorruptible society • Increase the awareness of the problem of the corruption