Kruskal Wallis and the Friedman Test
320 likes | 1.18k Vues
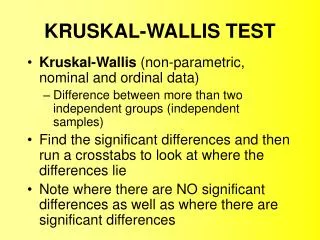
Kruskal Wallis and the Friedman Test. Kruskal Wallace One-Way Analysis of Variance. Nonparametric Equivalent of the one-way ANOVA One IV with 3 or more independent levels DV – ordinal data

Kruskal Wallis and the Friedman Test
E N D
Presentation Transcript
Kruskal Wallis and the Friedman Test
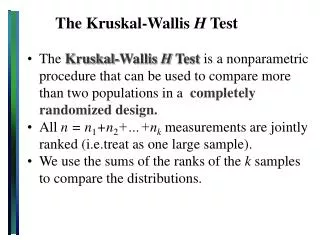
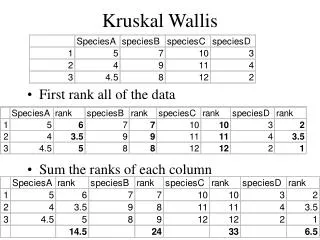
Kruskal Wallace One-Way Analysis of Variance • Nonparametric Equivalent of the one-way ANOVA • One IV with 3 or more independent levels • DV – ordinal data • Kruskal Wallis involves the analysis of the sums of ranks for each group, as well as the mean rank for each group. • As sample sizes get larger, the distribution of the test statistic approaches that of χ2, with df = k - 1 • Post hoc analysis would require that one conduct multiple pairwise comparisons using a procedure like the Mann Whitney U.
Computing the Kruskal Wallis • Data entered into two columns just like for a one-way ANOVA one column for the IV with three or more value labels one column for the DV (ratings) • Analyze Nonparametric K Independent Samples • Verify that the Kruskal Wallis Test has been selected • Transfer the IV to the Grouping Variable box Click Define Range and enter the range Min = 1 and Max = 3 Click Continue Transfer the DV (ratings) to the Test Variable List Click OK • To obtain descriptives for the levels of the IV, go to Descriptives Explore Transfer the IV to the factor list and the DV to the dependent list (the same as in the Mann Whitney)
Interpreting the Output The test statistic for the Kruskall Wallis is the Chi-Square. The degrees of freedom and the significance level are provided, as well.
The Friedman Test • Nonparametric equivalent of the repeated measures ANOVA • One IV with 3 or more dependent levels • DV – ordinal data • The ranks for each condition are summed and compared. • As sample sizes get larger, the distribution of the test statistic approaches that of χ2, with df = k - 1 • When the obtained test statistic is significant, there are post hoc procedures available to determine where the difference lies.
Computing the Friedman in SPSS • Define the variables as you did for the repeated measures ANOVA As many columns as there are levels of the IV The ranks or ratings for each level are entered into the corresponding columns • To generate Descriptives: Analyze Descriptive Statistics Explore Transfer all levels of the IV to the dependent list Click Statistics Check Descriptives Continue OK • Analyze Nonparametric Statistics K Related Samples Verify that the Friedman test has been selected Transfer all data sets to the right window Click OK
Interpreting the Output Again, the test statistic is the Chi-Square. Degrees of freedom and significance of the test statistic are also provided.