Section 2.2, Part 1 Standard Normal Calculations
Section 2.2, Part 1 Standard Normal Calculations. AP Statistics Berkley High School/CASA. Comparing data sets. How do we compare results when they are measured on two completely different scales? One solution might be to look at percentiles

Section 2.2, Part 1 Standard Normal Calculations
E N D
Presentation Transcript
Section 2.2, Part 1Standard Normal Calculations AP Statistics Berkley High School/CASA
Comparing data sets • How do we compare results when they are measured on two completely different scales? • One solution might be to look at percentiles • What might you say about a woman that is in the 50th percentile and a man in the 15th percentile? AP Statistics, Section 2.2, Part 1
Another way of comparing • Another way of comparing: Look at whether the data point is above or below the mean, and by how much. • Example: A man is 64 inches tall. The heights of men are normally distributed with a mean of 69 inches and standard deviation of 2.5 inches. AP Statistics, Section 2.2, Part 1
Another way of comparing • Example: A man is 64 inches tall. The heights of men are normally distributed with a mean of 69 inches and standard deviation of 2.5 inches. • We can see that the man is below the mean, but by how much? AP Statistics, Section 2.2, Part 1
Another way of comparing • Example: A man is 64 inches tall. The heights of men are normally distributed with a mean of 69 inches and standard deviation of 2.5 inches. AP Statistics, Section 2.2, Part 1
z-scores • The z-score is a way of looking at every data set, because each data set has a mean and standard deviation • We call the z-score the “standardized” score. AP Statistics, Section 2.2, Part 1
z-scores • Positive z-scores mean the data point is above the mean. • Negative z-scores mean the data point is below the mean. • The larger the absolute value of the z-score, the more unusual it is. AP Statistics, Section 2.2, Part 1
Using the z-table • We can use the z-table to find out the percentile of the observation. • A z-score of -2.0 is at the 2.28 percentile. AP Statistics, Section 2.2, Part 1
Cautions • The z-table only gives the amount of data found below the z-score. • If you want to find the portion found above the z-score, subtract the probability found on the table from 1. AP Statistics, Section 2.2, Part 1
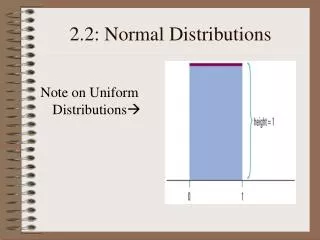
Standardized Normal Distribution • We should only use the z-table when the distributions are normal, and data has been standardized • N(μ,σ) is a normal distribution • N(0,1) is the standard normal distribution • “Standardizing” is the process of doing a linear translation from N(μ,σ) into N(0,1) AP Statistics, Section 2.2, Part 1
Example • Men’s heights are N(69,2.5). • What percent of men are taller than 68 inches? AP Statistics, Section 2.2, Part 1
Working with intervals • What proportion of men are between 68 and 70 inches tall? AP Statistics, Section 2.2, Part 1
Working backwards • How tall must a man be in order to be in the 90th percentile? AP Statistics, Section 2.2, Part 1
Working backwards • How tall must a woman be in order to be in the top 15% of all women? AP Statistics, Section 2.2, Part 1
Working backwards • What range of values make up the middle 50% of men’s heights? AP Statistics, Section 2.2, Part 1
Assignment • Exercises 2.19 – 2.25, The Practice of Statistics. AP Statistics, Section 2.2, Part 1