Download
1 / 5
50 likes | 176 Vues
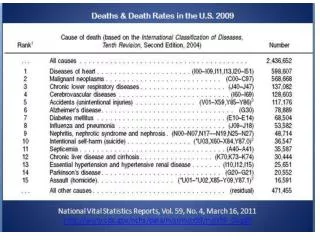
White Mold Risk Summary The risk level for this disease has receded northward slightly as temperatures have increased, but is still high in some areas. Next two-week risk interpretation:

E N D
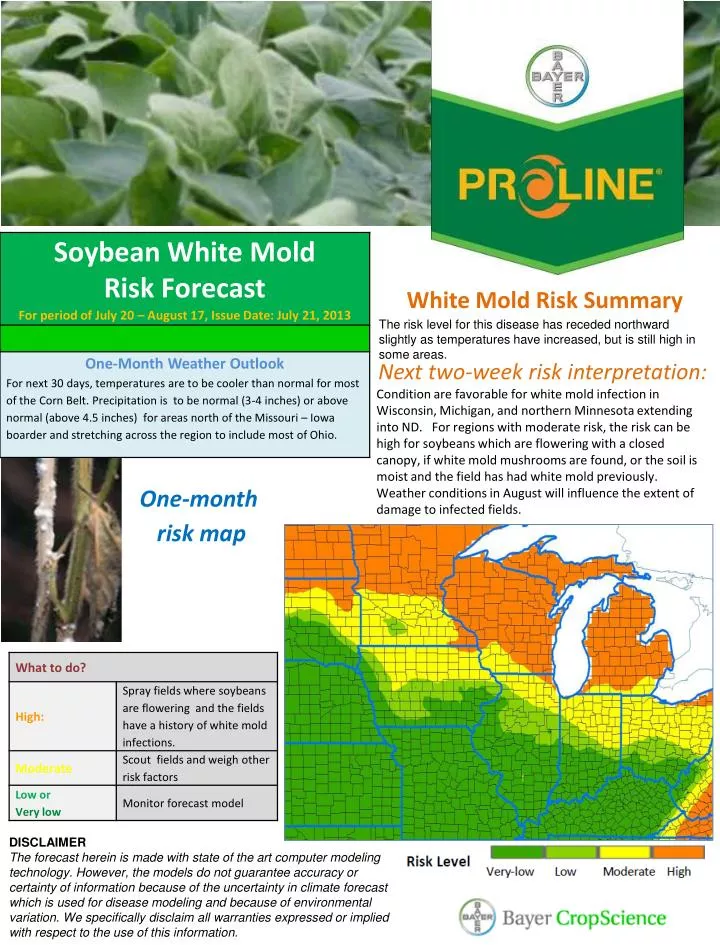
White Mold Risk Summary The risk level for this disease has receded northward slightly as temperatures have increased, but is still high in some areas. Next two-week risk interpretation: Condition are favorable for white mold infection in Wisconsin, Michigan, and northern Minnesota extending into ND. For regions with moderate risk, the risk can be high for soybeans which are flowering with a closed canopy, if white mold mushrooms are found, or the soil is moist and the field has had white mold previously. Weather conditions in August will influence the extent of damage to infected fields. One-month risk map DISCLAIMERThe forecast herein is made with state of the art computer modeling technology. However, the models do not guarantee accuracy or certainty of information because of the uncertainty in climate forecast which is used for disease modeling and because of environmental variation. We specifically disclaim all warranties expressed or implied with respect to the use of this information.
Grey Leaf Spot Risk Summary The risk of gray leaf spot infection has not changed dramatically from the last forecast. Next two-week risk interpretation The risk is high in east-central Illinois and Indiana, especially for early planted corn. For most of the US Corn Belt, the risk is moderate. In regions with moderate risk, diseased leaves may be found first on the lower leaves of the plants. One-month risk map DISCLAIMERThe forecast herein is made with state of the art computer modeling technology. However, the models do not guarantee accuracy or certainty of information because of the uncertainty in climate forecast which is used for disease modeling and because of environmental variation. We specifically disclaim all warranties expressed or implied with respect to the use of this information.
Northern Leaf Blight Risk Summary The risk of northern leaf blight remains at similar levels from the last forecast for the Corn Belt. Next two-week risk interpretation The risk of infection is high for parts of Indiana and Ohio and is moderate for most of the US Corn Belt, including eastern Iowa, most part of Illinois, southern Wisconsin and southern Minnesota. It remains relatively light for the western Corn Belt. One-month risk map DISCLAIMERThe forecast herein is made with state of the art computer modeling technology. However, the models do not guarantee accuracy or certainty of information because of the uncertainty in climate forecast which is used for disease modeling and because of environmental variation. We specifically disclaim all warranties expressed or implied with respect to the use of this information.
Brown Spot Risk Summary Risk of this disease has increased in parts of Ohio, Iowa, and Minnesota . Next two-week risk interpretation The risk has increased in southern MN, eastern IA, and part of IL. It remains high in southern Ohio and Kentucky. This disease sets a condition for premature defoliation later in the summer where brown spot has become established. One-month risk map DISCLAIMERThe forecast herein is made with state of the art computer modeling technology. However, the models do not guarantee accuracy or certainty of information because of the uncertainty in climate forecast which is used for disease modeling and because of environmental variation. We specifically disclaim all warranties expressed or implied with respect to the use of this information.
Predicted temperature and rainfall (For the period of July 20 to August 17)