Sampling Distributions for Counts and Proportions
Sampling Distributions for Counts and Proportions Chapter 5 Binomial distributions for sample counts Binomial distributions are models for some categorical variables, typically representing the number of successes in a series of n trials. The observations must meet these requirements:

Sampling Distributions for Counts and Proportions
E N D
Presentation Transcript
Binomial distributions for sample counts Binomial distributions are models for some categorical variables, typically representing the number of successes in a series of n trials. The observations must meet these requirements: • The total number of observations n is fixed in advance. • Each observation falls into just 1 of 2 categories: success and failure. • The outcomes of all n observations are statistically independent. • All n observations have the same probability of “success,” p. We record the next 50 births at a local hospital. Each newborn is either a boy or a girl; each baby is either born on a Sunday or not.
We express a binomial distribution for the count X of successes among n observations as a function of the parameters n and p:B(n,p). • The parameter n is the total number of observations. • The parameter p is the probability of success on each observation. • The count of successes X can be any whole number between 0 and n. A coin is flipped 10 times. Each outcome is either a head or a tail. The variable X is the number of heads among those 10 flips, our count of “successes.” On each flip, the probability of success, “head,” is 0.5. The number X of heads among 10 flips has the binomial distribution B(n = 10, p = 0.5).
Applications for binomial distributions Binomial distributions describe the possible number of times that a particular event will occur in a sequence of observations. They are used when we want to know about the occurrence of an event, not its magnitude. • In a clinical trial, a patient’s condition may improve or not. We study the number of patients who improved, not how much better they feel. • Is a person ambitious or not? The binomial distribution describes the number of ambitious persons, not how ambitious they are. • In quality control we assess the number of defective items in a lot of goods, irrespective of the type of defect.
Imagine that coins are spread out so that half of them are heads up, and half tails up. Close your eyes and pick one. The probability that this coin is heads up is 0.5. However, if you don’t put the coin back in the pile, the probability of picking up another coin and having it be heads up is now less than 0.5. The successive observations are not independent. Likewise, choosing a simple random sample (SRS) from any population is not quite a binomial setting. However, when the population is large, removing a few items has a very small effect on the composition of the remaining population: successive observations are very nearly independent.
Binomial distribution in statistical sampling A population contains a proportion p of successes. If the population is much larger than the sample, the count X of successes in an SRS of size n has approximately the binomial distribution B(n, p). The n observations will be nearly independent when the size of the population is much larger than the size of the sample. As a rule of thumb, the binomial sampling distribution for counts can be used when the population is at least 20 times as large as the sample.
Reminder: Sampling variability Each time we take a random sample from a population, we are likely to get a different set of individuals and calculate a different statistic. This is called sampling variability. If we take a lot of random samples of the same size from a given population, the variation from sample to sample—the sampling distribution—will follow a predictable pattern.
Calculations The probabilities for a Binomial distribution can be calculated by using software. In Minitab, Menu/Calc/Probability Distributions/Binomial • Choose “Probability” for theprobability of a given number of successes P(X = x) • Or “Cumulative probability” for the density function P(X ≤ x)
Binomial mean and standard deviation a) The center and spread of the binomial distribution for a count X are defined by the mean m and standard deviation s: b) Effect of changing p when n is fixed. a) n = 10, p = 0.25 b) n = 10, p = 0.5 c) n = 10, p = 0.75 For small samples, binomial distributions are skewed when p is different from 0.5. c)
Color blindness The frequency of color blindness (dyschromatopsia) in the Caucasian American male population is estimated to be about 8%. We take a random sample of size 25 from this population. The population is definitely larger than 20 times the sample size, thus we can approximate the sampling distribution by B(n = 25, p = 0.08). • What is the probability that five individuals or fewer in the sample are color blind? P(x≤ 5) = 0.9877 • What is the probability that more than five will be color blind? P(x> 5) = 1 P(x≤ 5) =1 0.9666 = 0.0123 • What is the probability that exactly five will be color blind? P(x= 5) = 0.0329
B(n = 25, p = 0.08) Probability distribution and histogram for the number of color blind individuals among 25 Caucasian males.
What are the mean and standard deviation of the count of color blind individuals in the SRS of 25 Caucasian American males? µ = np = 25*0.08 = 2 σ = √np(1 p) = √(25*0.08*0.92) = 1.36 What if we take an SRS of size 10? Of size 75? µ = 10*0.08 = 0.8 µ = 75*0.08 = 6 σ = √(10*0.08*0.92) = 0.86 σ = √(75*0.08*0.92) = 3.35 p = .08 n = 10 p = .08 n = 75
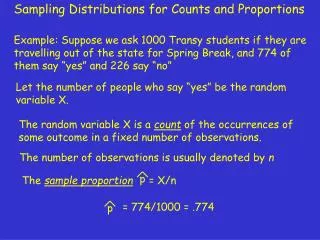
Sample proportions The proportion of “successes” can be more informative than the count. In statistical sampling the sample proportion of successes, , is used to estimate the proportion p of successes in a population. For any SRS of size n, the sample proportion of successes is: In an SRS of 50 students in an undergrad class, 10 are Hispanic:= (10)/(50) = 0.2 (proportion of Hispanics in sample) The 30 subjects in an SRS are asked to taste an unmarked brand of coffee and rate it “would buy” or “would not buy.” Eighteen subjects rated the coffee “would buy.” = (18)/(30) = 0.6 (proportion of “would buy”)
If the sample size is much smaller than the size of a population with proportion p of successes, then the mean and standard deviation of are: • Because the mean is p, we say that the sample proportion in an SRS is an unbiased estimator of the population proportion p. • The variability decreases as the sample size increases. So larger samples usually give closer estimates of the population proportion p.
Normal approximation If n is large, and p is not too close to 0 or 1, the binomial distribution can be approximated by the normal distribution N(m = np,s2 = np(1 p)). Practically, the Normal approximation can be used when both np≥10 and n(1 p) ≥10. If X is the count of successes in the sample and = X/n, the sample proportion of successes, their sampling distributions for large n, are: • X approximately N(µ = np,σ2 = np(1 − p)) • is approximately N(µ = p, σ2 = p(1 − p)/n)
Sampling distribution of the sample proportion The sampling distribution of is never exactly normal. But as the sample size increases, the sampling distribution of becomes approximately normal. The normal approximation is most accurate for any fixed n when p is close to 0.5, and least accurate when p is near 0 or near 1.
Color blindness The frequency of color blindness (dyschromatopsia) in the Caucasian American male population is about 8%. We take a random sample of size 125 from this population. What is the probability that six individuals or fewer in the sample are color blind? • Sampling distribution of the count X: B(n = 125, p = 0.08) np = 10P(X≤ 6) = 0.1198 or about 12% • Normal approximation for the count X: N(np = 10, √np(1 p) = 3.033)P(X≤ 6) = 0.0934 or 9%Or z = (xµ)/σ = (6 10)/3.033 = 1.32 P(X≤ 6) = 0.0934 from Table A The normal approximation is reasonable, though not perfect. Here p = 0.08 is not close to 0.5 when the normal approximation is at its best. A sample size of 125 is the smallest sample size that can allow use of the normal approximation (np = 10 and n(1 p) = 115).
Sampling distributions for the color blindness example. n = 50 The larger the sample size, the better the normal approximation suits the binomial distribution. Avoid sample sizes too small for np or n(1 p) to reach at least 10 (e.g., n = 50). n =1000 n = 125