Sampling and Sampling Distributions
Sampling and Sampling Distributions. A statistical population is the aggregate of all the units pertaining to a study. i.e. it is the set of all elements about which we wish to make inferences. A sample is a subset of a population.


Sampling and Sampling Distributions
E N D
Presentation Transcript
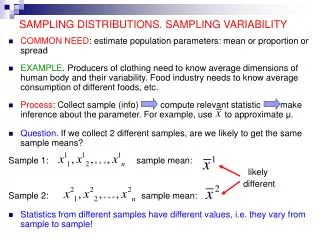
A statistical population is the aggregate of all the units pertaining to a study. i.e. it is the set of all elements about which we wish to make inferences. A sample is a subset of a population. The process of drawing a sample from a large population is called sampling. STATISTIC: Characteristic or measure obtained from a sample. PARAMETER: Characteristic or measure obtained from a population. A sampling distribution is the probability distribution, under repeated sampling of the population, of a given statistic.
Consider a very large population. • Assume we repeatedly take samples of a given size from the population and calculate the sample mean for each sample. • Different samples will lead to different sample means. • The distribution of these means is the “sampling distribution of the sample mean”.
When all of the possible sample means are computed, then the following properties are true: • The mean of the sample means will be the mean of the population (μ). • The variance of the sample means will be the variance of the population divided by the sample size (σ2/n). • The standard deviation of the distribution of a sample statistic is known as thestandard error of the statistic. The nature of the sampling distribution depends on the distribution of the population and/or the statistic being considered and the sample size used.
A population comprises of four numbers: 3, 5, 7 and 9 (a) List all possible samples of size 2 that can be drawn from the population without replacement. (b) Show that the mean of the sampling distribution of sample means is equal to the population mean. (c) Calculate the standard deviation of the sampling distribution of sample means and hence, show that it is less than the population standard deviation.
Hypothesis is an assumption about a population A few examples are as follows: • Mean purchases made by females (μ1) is more than or equal to the mean purchases made by males (μ2) in a textile stores (μ1> μ2). • Mean age of female shoppers (μ1) is less than or equal to that of male shoppers (μ2) in a book exhibition (μ1< μ2). • Mean monthly income of buyers (μ) in a shop is more than or equal to Rs 10000\- (μ > 10000). • The mean stay-over time of customers (μ) in a shop is at most 45 minutes (μ < 45).
Definitions Parameter: It is a function of population values. Statistic: It is a function of sample values. Null Hypothesis: It is an assumption about the population parameter which the statement of no change. It is denoted by H0. Alternate Hypothesis: It is the statement of assumption which can be considered to be the alternative to the null hypothesis is called the alternative hypothesis. It is denoted by H1.
As long as there is no apparent contradiction to the null hypothesis, we retain this belief. But, when we find observations contradicting it, there is a reason to suspect the validity of this null hypothesis and the problem of testing the null hypothesis arises. When we proceed to test H0, we must be aware of the assumption that is expected to be valid if null hypothesis turns out to be valid if null hypothesis turns out to be invalid. This assumption is known as alternative hypothesis.
H0: The mean I.Q. of all persons in a city is 105 • H1: The mean I.Q. of all persons in the city is 100 • (if it is known that the mean I.Q. is 105 or 100 and nothing else) • OR • H1: The mean I.Q. of all the persons in the city is less than 105 • (if it is known that the mean I.Q. is not more than 105) • OR • H1: The mean I.Q. of all the persons in the city is more than 105 • (if it is known that the mean I.Q. is not less than 105) • OR • H1: The mean I.Q. of all the persons is not equal to 105 • (if any information is absent)
The first thing to do when given a claim is to write the claim mathematically (if possible), and decide whether the given claim is the null or alternative hypothesis. If the given claim contains equality, or a statement of no change from the given or accepted condition, then it is the null hypothesis, otherwise, if it represents change, it is the alternative hypothesis.
Example "He's dead,” said Dr. X to Captain K. Mr. S, as the science officer, is put in charge of statistically determining the correctness of Xs' statement and deciding the fate of the crew member (to vaporize or try to revive) His first step is to arrive at the hypothesis to be tested. Does the statement represent a change in previous condition? Yes, there is change, thus it is the alternative hypothesis, H1 No, there is no change, therefore is the null hypothesis, H0
The correct answer is that there is change. Dead represents a change from the accepted state of alive. The null hypothesis always represents no change. Therefore, the hypotheses are: • H0: Patient is alive. • H1: Patient is not alive (dead).
PROCEDURE IN HYPOTHESIS TESTING • Formulate the Hypothesis: Set up a null hypothesis based on the belief and an appropriate alternate hypothesis. 2. Set up a Suitable Significance Level: The confidence with which a null hypothesis is rejected or accepted depends upon the significance level used for the purpose. A level of significance say 5% means the risk of making a wrong decision is only in 5 out of 100 cases. Level of significance widely used is 5% or 1%. Thus, a 1% level of significance provides greater confidence to the decision than a 5% significance level as the risk of making wrong decision is only in 1 out of 100 cases. It is denoted by a Greek alphabet alpha (α). Where (1 –α)is the CONFIDENCE LEVEL.
3. Select Test Criterion: The test criterion is selected on the basis of sample size. If the sample is large (n 30), the z-test implying normal distribution is used; whereas if the sample size is small (n < 30), the t-test is more suitable. The most commonly used tests are z, t, F and χ2. A corresponding TEST STATISTIC is calculated. 4. Decision Criterion: The Test Statistic calculated in the previous step is now classified to fall within the acceptance region or the rejection region at the given level of significance. Accordingly the null hypothesis is accepted or rejected. 5. Conclusion: On the basis of the decision the conclusion is stated.
ERRORS IN DECISION MAKING • The problem of testing of a hypothesis is actually a problem of deciding whether to accept or to reject the null hypothesis H0, in favor of alternate hypothesis H1. • The decision of rejecting or accepting of the null hypothesis is taken on the basis of observations made only on a sample of units selected from the population. This decision cannot be always correct. When this decision is not correct, an error is said to occur.
States of nature are something that you, as a decision maker has no control over. Either it is, or it isn't. This represents the true nature of things. Possible states of nature (Based on H0) • Crew member is alive (H0 true /H1false ) • Crew member is dead (H0 false / H1 true)
Decisions are something that you have control over. You may make a correct decision or an incorrect decision. It depends on the state of nature as to whether your decision is correct or incorrect. Possible decisions (Based on H0) / conclusions (Based on claim) • Reject H0 if sufficient evidence to say patient is dead, is available • Fail to Reject H0 if sufficient evidence to say patient is dead, is not available
Following table gives the possibilities that exist in reality.
Type I Error Reject H0, when H0 is True Type II Error Do Not Reject H0, when H0 is Not True Which of the two errors is more serious? Type I or Type II?
Level of significance To design a good test we would like to arrive at a decision criterion in such a way that none of the two errors, (Type I Error and Type II Error) occur. But when P(Type I Error) → 0, P(Type II Error) → 1 & when P(Type II Error) → 0, P(Type I Error) → 1 Hence, no test can be perfect. We therefore design a test such that one of the two probabilities is restricted to a small value α (0 < α < 1 and α is closer to 0) and then minimize probability of the other error.
The error in rejecting H0, when it is true (Type I Error) is more serious error than (Type II Error), therefore an upper limit is put on P(Type I Error) and P(Type II Error) is simultaneously minimized. This upper limit is known as level of significance. Thus, a test is so designed that P(Type I Error) < α then α is called level of significance Hence, α = Max. P(Type I Error).
DECISION CRITERION In p-value of the test statistic is less than the level of significance α, reject H0.
Distributions used in testing of hypothesis In order to test different parameters, for different sample sizes and comparisons of such parameters for multiple populations, different statistical distributions are used.
For testing association between two variables Chi-Square test for Independence of Attributes is used. Expected frequencies are calculated using the following formula: E= O= Observed frequencies
For fitting a distribution to a given data Chi-Square test for Goodness of Fit is used Expected frequencies are calculated depending upon the distribution.