Download
1 / 109
1.09k likes | 1.51k Vues
Chronic Disease Prevention and Control in Austin/Travis County. Denton Cardiovascular Health Summit August 26, 2010 . Agenda:. Burden of Chronic Disease in Austin/Travis County Behavioral Risk Factor Data What we are doing to address chronic disease

E N D
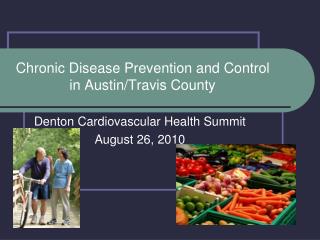
Chronic Disease Prevention and Control in Austin/Travis County Denton Cardiovascular Health Summit August 26, 2010
Agenda: • Burden of Chronic Disease in Austin/Travis County • Behavioral Risk Factor Data • What we are doing to address chronic disease • PRISM Modeling for priority setting and projecting impact of proposed interventions
Burden of Chronic Diseases • Leading causes of disability and death in Texas and in the United States • Account for 3 out of every 4 deaths • Cause major limitations in daily living for more than 1 of every 10 Americans • Chronic diseases account for 1/3 of the years of potential life lost before age 65 • Account for 75% of the $1 trillion spent on health care each year in the United States
The leading causes of death have changed in this century from infectious diseases to chronic diseases In 1900, pneumonia and influenza, TB, and gastritis, enteritis, and colitis were the 3 leading causes of death accounting for nearly 1/3 of all deaths. Today, heart disease, cancer and stroke are the 3 leading causes of death accounting for almost 2/3 of all deaths.
Leading Causes of Death, Travis County, 2007 Data Source: Texas Department of State Health Services, Center for Health Statistics http://soupfin.tdh.state.tx.us/death10.htm
Diseases of the Heart1 Age Adjusted Mortality Rate Travis County 1999-2006 1 ICD 9 Codes: I00-I09, I11, I13, I20-I51 Data Source: Texas Department of State Health Services, Center for Health Statistics http://soupfin.tdh.state.tx.us/death10.htm
Age-Adjusted Heart Disease Mortality Rate by Zip Code of Residence Travis County, Texas This map has been produced by the Austin/Travis County Health & Human Services Department as a working staff map. No warranty is made by A/TCHHSD regarding its accuracy or completeness. 2001-2004 Rates per 100,000
Cancer Death Rates*, for Men, US, 1930-1999 Rate Per 100,000 Lung Prostate Stomach Colon and rectum Pancreas Leukemia Liver *Age-adjusted to the 2000 US standard population. Source: US Mortality Public Use Data Tapes 1960-1999, US Mortality Volumes 1930-1959, National Center for Health Statistics, Centers for Disease Control and Prevention, 2002.
Cancer Death Rates*, for Women, US, 1930-1999 Rate Per 100,000 Lung Uterus Breast Colon and rectum Stomach Ovary Pancreas *Age-adjusted to the 2000 US standard population. Source: US Mortality Public Use Data Tapes 1960-1999, US Mortality Volumes 1930-1959, National Center for Health Statistics, Centers for Disease Control and Prevention, 2002.
Lung and Bronchus Cancer1 Age Adjusted Mortality Rate Travis County 1999-2006 1 ICD 9 Codes: C34 * The number of deaths due to Lung and Bronchus Cancer for Hispanics is too small for rate calculation in 2001 and 2003. Data Source: Texas Department of State Health Services, Texas Cancer Registry, http://www.cancer-rates.info/tx/
Age-Adjusted Lung Cancer Mortality Rate by Zip Code of Residence Travis County, Texas This map has been produced by the Austin/Travis County Health & Human Services Department as a working staff map. No warranty is made by A/TCHHSD regarding its accuracy or completeness. 2001-2004 Rates per 100,000
Diabetes Mellitus1 Age Adjusted Mortality Rate Travis County 1999-2006 1 ICD 9 Codes:E10-E14 The number of deaths due to Diabetes Mellitus for Black Non-Hispanics is too small for rate calculation in 1999, 2005, and 2006. Data Source: Texas Department of State Health Services, Center for Health Statistics, http://soupfin.tdh.state.tx.us/death10.htm
Age-Adjusted Diabetes Mortality Rate by Zip Code of Residence Travis County, Texas This map has been produced by the Austin/Travis County Health & Human Services Department as a working staff map. No warranty is made by A/TCHHSD regarding its accuracy or completeness. 2001-2004 Rates per 100,000
Behavioral Risk Factors and Disease Prevalence From BRFSS Cigarette Smoking Overweight/Obesity Lack of Physical Activity Poor Nutrition Diabetes
Leading Causes of Death, Travis County, 2007 Data Source: Texas Department of State Health Services, Center for Health Statistics http://soupfin.tdh.state.tx.us/death10.htm
Smoking-Attributable DeathsTravis County, 2007 Approximately 584 deaths caused by smoking among adults 35+ years in Travis County (over 11 each week)
Health Effects of Tobacco Use • Cigarette smoking remains the leading preventable cause of death in the United States, causing an estimated 438,000 deaths - or about 1 out of every 5 - each year. (In 2007 in Travis County approximately 584 smoking-related deaths-over 11 per week) • Tobacco kills more than AIDS, heroin, cocaine, alcohol, car accidents, fire and murder – combined. • Lung cancer is the leading cause of cancer death among both men and women in the United States, with 85- 90 percent of lung cancer deaths attributed to smoking. • Smoking also increases the risk of many other types of cancer, including cancers of the throat, mouth, pancreas, kidney, bladder, and cervix. • People who smoke are up to six times more likely to suffer a heart attack than nonsmokers, and the risk increases with the number of cigarettes smoked. Smoking also causes most cases of chronic obstructive lung disease, which includes bronchitis and emphysema. • In the United States, approximately 38,000 deaths each year are caused by exposure to secondhand smoke.
Second-Hand Smoke (SHS) • Public Health Issue • Contains over 4,000 chemicals including 69 known carcinogens • Group A Carcinogen (like asbestos and benzene) • Health Effects: Adults • Lung cancer • Coronary heart disease • Health Effects: Children • Lower respiratory tract infections in children < 18 months old each year • Middle ear infections • Asthma • SIDS
Even Brief Exposure to SHS Poses Serious Health Risks • Even brief exposure to SHS can: • result in upper airway changes in healthy persons • lead to more frequent asthma attacks in asthmatic children • Just 30 minutes of exposure to SHS can: • increase risk of blot clots • slow the rate of blood flow through the coronary arteries • injure blood vessels and interfere with their repair
Who Smokes – By Education and IncomeCurrent Population Survey - Tobacco Use Supplement
Prevalence of Cigarette Smoking Among Youth1, Texas’ Public Schools 2001, 2005, 2007, 2009 1Youth is defined as a student in public schools ranging in age from 15-18 years old. Data Source: Texas Department of State Health Services, Center for Health Statistics http://www.dshs.state.tx.us/chs/yrbs/query/yrbss_form.shtm
Prevalence of Cigarette Smoking Among Youth1, STEPS to a Healthier Austin Intervention Area’s Public Schools 2007 Percentage of students who smoked cigarettes on one or more of the past 30 days 100 80 60 40 19.4 20.5 13.8 14.0 20 11.1 12.5 9.6 7.2 9.1 10.7 0 Total Male Female 9th 10th 11th 12th Black* Hispanic/ White* Latino 1Youth is defined as a student in public schools ranging in age from 15-18 years old. Data Source: Centers for Disease Control and Prevention, Youth Risk Behavior Survey QN30 - Weighted Data *Non-Hispanic.
Prevalence of Overweight and Obesity1 among Adults2 2002-2008 1BMI Overweight and Obsesity ≥25 2Adults are defined as respondents 18 years old and older. Data Source: Texas Department of State Health Services, Center for Health Statistics, http://www.dshs.state.tx.us/chs/brfss/query/brfss_form.shtm; Austin/Travis County Health & Human Services Department
Prevalence of Overweight Youth1 in Texas’ Public Schools 2001, 2005, 2007, and 2009 1Youth is defined as a student in public schools ranging in age from 15-18 years old. Data Source: Texas Department of State Health Services, Center for Health Statistics http://www.dshs.state.tx.us/chs/yrbs/query/yrbss_form.shtm
Prevalence of Lack of Physical Activity1 Among Adults2, 2002-2008 1Lack of activity is defined as respondents who report no leisure-time physical activity during the past month. 2Adults are defined as respondents 18 years old and older. Data Source: Texas Department of State Health Services, Center for Health Statistics http://www.dshs.state.tx.us/chs/brfss/query/brfss_form.shtm; Austin/Travis County Health & Human Services Department
Prevalence of Lack of Physical Activity1 Among Adults2Travis County 2008 1Lack of activity is defined as respondents 18 years and older who report no leisure-time physical activity during the past month. 2Adults are defined as respondents 18 years old and older. In 2008, the sample sizes for Black non-Hispanics and 18-29 year olds were less than 50 respondents and consequently data could not be analyzed. Data Source: Austin/Travis County Health & Human Services Department
Prevalence of Lack of Physical Activity1 in Adults2, Travis County, 2008 1Lack of activity is defined as respondents 18 years and older who report no leisure-time physical activity during the past month. 2Adults are defined as respondents 18 years old and older. In 2008, the sample size for Less than High School was less than 50 respondents and consequently data could not be analyzed. Data Source: Texas Department of State Health Services, Center for Health Statistics http://www.dshs.state.tx.us/chs/brfss/query/brfss_form.shtm
Prevalence of Poor Nutrition1in Adults2, Austin-Round Rock MSA, 2007 1Poor nutrition is defined as eating certain fruits, fruit juices, or vegetables less than 5 times per day. 2Adults are defined as respondents 18 years old and older. In 2008, the sample size for Black non-Hispanics was less than 50 respondents and consequently data could not be analyzed. Data Source: Texas Department of State Health Services, Center for Health Statistics http://www.dshs.state.tx.us/chs/brfss/query/brfss_form.shtm
Prevalence of Eating 5 or More Fruits and Vegetables Per Day in Youth1 in Texas’ Public Schools, 2001, 2005, 2007, and 2009 1Youth is defined as a student in public schools ranging in age from 15-18 years old. Data Source: Texas Department of State Health Services, Center for Health Statistics http://www.dshs.state.tx.us/chs/yrbs/query/yrbss_form.shtm
Prevalence of Diabetes1 in Adults2, United States, Texas, Travis County 2002-2008 1Doctor diagnosed as having diabetes but not diagnosed while pregnant 2Adults are defined as respondents 18 years old and older. Data Source: Texas Department of State Health Services, Center for Health Statistics, http://www.dshs.state.tx.us/chs/brfss/query/brfss_form.shtm (US, Texas) Austin/Travis County Health and Human Services Department, (Travis County)
Prevalence of Diabetes1 in Adults2 by Sex, Race/Ethnicity, and Age Group, Travis County - 2008 1Doctor diagnosed as having diabetes but not diagnosed while pregnant 2Adults are defined as respondents 18 years old and older. Data Source: Austin/Travis County Health & Human Services Department
Potentially Preventable Hospitalizations Travis County, 2005-2008
Economic Cost • In 1998/1999, Texas Smoking-Attributable Costs = $10.09 billion • Direct Medical expenditures - $4.55 billion • Lost Productivity costs - $5.54 billion • In 1998, about 15% ($1,265,000,000 or $543.87 per recipient) of all Texas Medicaid expenditures were spent on smoking-related illnesses and diseases. (includes state and federal contributions to Medicaid)
Economic Costs Due To SmokingTravis County, 2007 584 deaths caused by smoking among adults 35+ years • Loss of future earnings and productivity of $165.4 million • 2004 Direct Health Care Costs for Travis County- $243 million
Texas Employer Costs of Smoking Estimated annual EXCESS absence and productivity cost per smoker $2,625 (not including health costs) • Smoke breaks $2,261 • 26 minutes per day more than non-smokers (Source: Study by Halpern and Rentz) multiplied by the Texas average hourly wage $19.76 (Source: Bureau of Labor Statistics, May 2009) • Absences $364 • 2.3 days of additional absences (Source: Study by Halpern and Rentz) multiplied by Texas average hourly wage of $19.76. (Source: Bureau of Labor Statistics, May 2009) Tobacco-free environments reduces smoking prevalence by 3.8% and helps ex-smokers by eliminating cues to smoke and (Study by Fichtenberg and Glantz).
Comprehensive smoke-free workplacelaws reduce cigarette consumption • “…total prohibition of smoking in the workplace strongly affects industry volume. Smokers facing these restrictions consume 11%-15% less than average and quit at a rate that is 85% higher than average...Milder workplace restrictions, such as smoking only in designated areas, have much less impact on quitting rates and very little effect on consumption.” • “…financial impact of smoking bans will be tremendous –three to five fewer cigarettes per day per smoker will reduce annual manufacturer profits a billion dollars plus per year.” - Excerpts from Philip Morris internal documents
Smokefree Laws:Economic Issues • The US EPA estimates that smokefree restaurants can expect to save about $190 per 1,000 square feet each year in lower cleaning and maintenance costs. • The National Fire Protection Association found that in 1998 smoking materials caused 8,700 fires in non-residential structures resulting in direct property damage of $60.5 million. • Landlords and restaurants with smokefree premises have negotiated lower fire and property insurance premiums.
Tobacco Industry Expenditures • In 2006 the Tobacco Industry spent $12.49 billion on advertising and promotion in the U.S. • Approximately $1.01 billion was spent in Texas in 2006 (over $2.76 million every single day) • Approximately $41.75 million was spent in Travis County in 2006 ($114,400 every single day)
Criteria for Evaluating Economic Studies • Based on objective data (i.e. sales tax) • Includes data for a sufficient time period before and after the ordinance • Accounts for underlying economic trends • Uses appropriate statistical methods • In peer-reviewed literature • Source of funding
Texas Economic StudiesMethods • Quarterly data obtained from the Texas Comptroller’s Office • Taxable restaurant, bar and mixed beverage sales • Total retail sales • Linear regression model to assess the economic impact of clean indoor air ordinances
Figure 1. Gross Restaurant, Bar and Mixed Beverage Revenues By Fiscal Quarter*—El Paso, Texas, 1990-2002 Smoking Ban in effect January 2, 2002 * First fiscal quarter of each year is January 1 –March 31
Figure 2. Restaurant, Bar and Mixed Beverage Revenues, Percent of Total Retail Revenues by Fiscal Quarter*—El Paso, Texas, 1990-2002 Smoking Ban in effect January 2, 2002 * First fiscal quarter of each year is January 1 –March 31