MAPP Model
Virginia’s Planning District 10 ( Thomas Jefferson Health District) Community Health Assessment 2012. MAPP Model. Source: Centers for Disease Control and Prevention; National Association of County and City Health Officials. MAPP 2 Health 2011-12. Locality CHA Councils

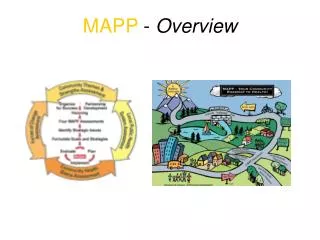
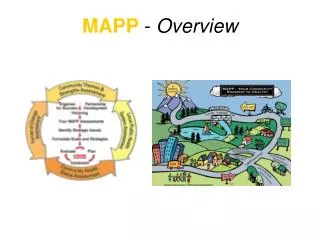
MAPP Model
E N D
Presentation Transcript
Virginia’s Planning District 10 (Thomas Jefferson Health District) Community Health Assessment2012
MAPP Model Source: Centers for Disease Control and Prevention; National Association of County and City Health Officials
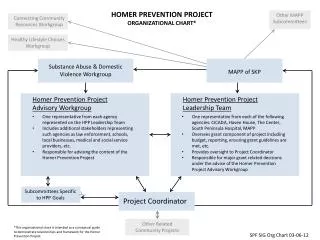
MAPP 2 Health 2011-12 • Locality CHA Councils • Review, discuss and determine need for additional quantitative and qualitative data • Prioritize health issues Charlottesville-Albemarle Fluvanna Greene Louisa Nelson • Local government • Schools • Colleges • Community agencies • Healthcare organizations • Non-profits • TJHD MAPP 2 Health Leadership Council • Decide health questions for TJHD phone survey • Complete Community Health Improvement Plan for TJHD • 1-2 reps per CHA locality council • District-wide agencies serving TJHD Source: Thomas Jefferson Health District
M2H Organizational Partners2012 Source: TJHD
Section One: Who are we and what do we bring to the table? Demographics Socioeconomics Health Resource Availability
Population GrowthTJHD by Locality, 1990-2010 Source: Weldon Cooper Center
Percent Change in PopulationTJHD by Locality, TJHD, and Virginia1990-2010 Source: Weldon Cooper Center and the Thomas Jefferson District Planning Commission
Age and Sex DistributionTJHD, 2010 Source: U.S. Census Bureau
Age Distribution TJHD, 2000,2010 Source: U.S. Census Bureau
Racial Composition TJHD, 2010 • Other includes: American Indian, Alaska Native, Native Hawaiian, Pacific Islander, and some other race Source: U.S. Census Bureau
Percent of Population by RaceTJHD by Locality, 1980-2010 Source: U.S. Census Bureau
Percent Change in Hispanic PopulationTJHD by Locality and Virginia, 2000,2010 Source: U.S. Census Bureau
Limited English Proficient Student Enrollment TJHD and Virginia, 2002-2012 Source: Virginia Department of Education
Limited English Proficient Student Enrollment TJHD by Locality, 2002-2012 *Note: For locality graphs such as this one, only the localities that start or end as the lowest and highest points are labeled Source: Virginia Department of Education
SSI and Disabled OASDI BeneficiariesTJHD by Locality and Virginia, 2011 Residents who received SSI (Supplemental Security Income) benefits, excluding those who also received OASDI (Old-Age, Survivors, and Disability Insurance) benefits to avoid duplication, PLUS persons classified as “Disabled” who received OASDI benefits. Source: U.S. Social Security Administration; U.S. Census Bureau
Percent of Supplemental Security Income (SSI) Recipients, TJHD by Locality, 2010 Greene County 1.3% Charlottesville 2.0% Louisa County 1.9% Albemarle County 0.9% Fluvanna County 1.0% Nelson County 2.4% *Measured as December 2010 recipients of SSI benefits divided by the total population Source: Weldon Cooper Center: County Health Rankings; U.S. Social Security Administration
Percent of Students Receiving Special Education TJHD by Locality, 2006-2010 Source: Virginia Department of Education; U.S. Census Bureau, Small Area Health Insurance Estimates
On-time* Graduation Rate: All StudentsTJHD by Locality and Virginia, 2008-2011 *The percentage of students in a cohort who earn a diploma within 4 years of entering high school **Cohort: Students who entered the ninth grade for the first time together and were scheduled to graduate 4 years later Source: Virginia Department of Education
On-time* Graduation Rate: Economically Disadvantaged StudentsTJHD by Locality and Virginia, 2008-2011 *The percentage of students in a cohort who earn a diploma within 4 years of entering high school **Cohort: Students who entered the ninth grade for the first time together and were scheduled to graduate 4 years later Source: Virginia Department of Education
Educational AttainmentCharlottesville Metro Area, and Virginia, 2011 Source: American Community Survey
Median Household IncomeVirginia and U.S., 2000-2011 Source: U.S. Census Bureau, Small Area Income and Poverty Estimates
Median Household IncomeTJHD by Locality, 2000-2011 Source: U.S. Census Bureau, Small Area Income and Poverty Estimates
Percent of Persons in PovertyTJHD by Locality, 2010 Greene County 9.7% Charlottesville 20.2% Louisa County 9.9% Albemarle County 9.1% Fluvanna County 7.3% Nelson County 13.1% Source: Weldon Cooper Center: County Health Rankings; US Census Bureau, Small Area Income and Poverty Estimates 2010
Percent of Persons in PovertyVirginia and U.S., 2000-2011 Source: U.S. Census Bureau, Small Area Income and Poverty Estimates
Percent of Persons in PovertyTJHD by Locality, 2000-2011 Source: U.S. Census Bureau, Small Area Income and Poverty Estimates
Percent of Children in PovertyVirginia and U.S., 2000-2011 Source: U.S. Census Bureau, Small Area Income and Poverty Estimates
Percent of Children in PovertyTJHD by Locality, 2000-2011 Source: U.S. Census Bureau, Small Area Income and Poverty Estimates
Percent of Students Eligible for Free/Reduced LunchTJHD and Virginia, 2005-2012 Source: Virginia Department of Education, School Nutrition Program
Percent of Students Eligible for Free/Reduced LunchTJHD by Locality, 2005-2012 Source: Virginia Department of Education, School Nutrition Program
Number of Households Receiving Supplemental Nutrition Assistance TJHD by Locality, 2001-2011 Percent Increase Albemarle: 313% Charlottesville: 120% Fluvanna: 387% Greene: 269% Louisa: 247% Nelson: 168% Source: Virginia Department of Social Services, SNAP Participation Report.
Percent of Supplemental Nutrition AssistanceProgram (SNAP) ParticipantsTJHD by Locality, 2010 Greene County 10.4% Charlottesville 12.6% Louisa County 11.8% Albemarle County 5.8% Fluvanna County 6.0% Nelson County 13.7% *Measured as average monthly persons on SNAP divided by the total population Source: Weldon Cooper Center: County Health Rankings; Virginia Department of Social Services
Number of Homeless PersonsTJHD, 2004-2011 Source: Thomas Jefferson Area Coalition for the Homeless (TJACH)
Unemployment RateTJHD, Virginia, & U.S., 2000-2011 Source: Virginia Workforce Connection
Unemployment RateTJHD by Locality, 2000-2011 Source: Virginia Workforce Connection
Sources of Health Insurance Virginia and U.S., 2010 Virginia United States Percentages may not sum to 100% due to rounding effects Source: Kaiser Family Foundation
Health Insurance Coverage by AgeVirginia, 2010-2011 Source: U.S. Census Bureau, Annual Social and Economic Supplement
Estimated Uninsured Persons, 18-64 TJHD and Virginia, 2005-2010 Source: U.S. Census Bureau, Small Area Health Insurance Estimates
Estimated Uninsured Persons, 18-64 TJHD by Locality, 2005-2010 Source: U.S. Census Bureau, Small Area Health Insurance Estimates
Estimated Uninsured Persons <19 Years TJHD and Virginia, 2006-2010 Source: U.S. Census Bureau, Small Area Health Insurance Estimates
Estimated Uninsured Persons <19 Years TJHD by Locality, 2006-2010 Source: U.S. Census Bureau, Small Area Health Insurance Estimates
Medicaid Enrollment and Spending by Recipient Group Virginia and U.S., FY 2009 Virginia United States Source: Kaiser Family Foundation
Number of Primary Care ProvidersTJHD by Locality, 2011 Source: UVA Physician Directory; Martha Jefferson Hospital Physician Directory
Number of Charlottesville Free Clinic Medical PatientsTJHD by Locality, FY2012 Source: Charlottesville Free Clinic
Number of Dental Service ProvidersTJHD by Locality, 2012 Source: Community Dental Center; DentaQuest; yellow pages
Number of Charlottesville Free Clinic Dental Patients, TJHD by Locality, FY2012 Source: Charlottesville Free Clinic
Average Number of Community Dental Center Patients Served Per Month, FY2010-2012 Source: Community Dental Center