Download

1 / 34
340 likes | 523 Vues
Databases Meet Astronomy a db view of astronomy data. Jim Gray Microsoft Research Collaborating with: Alex Szalay, Peter Kunszt, Ani Thakar @ JHU Robert Brunner, Roy Williams @ Caltech George Djorgovski, Julian Bunn @ Caltech. Outline. Astronomy data The Virtual Observatory Concept

E N D
Databases Meet Astronomya db view of astronomy data Jim Gray Microsoft Research Collaborating with: Alex Szalay, Peter Kunszt, Ani Thakar @ JHU Robert Brunner, Roy Williams @ Caltech George Djorgovski, Julian Bunn @ Caltech
Outline • Astronomy data • The Virtual Observatory Concept • The Sloan Digital Sky Survey
ComputationalScience • Traditional Empirical Science • Scientist gathers data by direct observation • Scientist analyzes data • Computational Science • Data captured by instrumentsOr data generated by simulator • Processed by software • Placed in a database • Scientist analyzes database
Astronomy Data Growth • In the “old days” astronomers took photos. • Starting in the 1960’s they began to digitize. • New instruments are digital (100s of GB/nite) • Detectors are following Moore’s law. • Data avalanche: double every 2 years Total area of 3m+ telescopes in the world in m2, total number of CCD pixels in megapixel, as a function of time. Growth over 25 years is a factor of 30 in glass, 3000 in pixels. 3+ M telescopes area m^2 Courtesy of Alex Szalay CCD area mpixels
Universal Access to Astronomy Data • Astronomers have a few Petabytes now. • 1 pixel (byte) / sq arc second ~ 4TB • Multi-spectral, temporal, … → 1PB • They mine it looking fornew (kinds of) objects or more of interesting ones (quasars), density variations in 400-D space correlations in 400-D space • Data doubles every 2 years. • Data is public after 2 years. • So, 50% of the data is public. • Some have private access to 5% more data. • So: 50% vs 55% access for everyone
Astronomy Data Publishing and Access • But….. • How do I get at that 50% of the data? • Astronomers have culture of publishing. • FITS files and many tools.http://fits.gsfc.nasa.gov/fits_home.html • Encouraged by NASA. • But, data “details” are hard to document. Astronomers want to do it but it is VERY hard.(What programs where used? What were the processing steps? How were errors treated?…) • The answer is 42.
Astronomy Data Access • And by the way, few astronomers have a spare petabyte of storage in their pocket. • But that is getting better: • Public SDSS is 5% of total • Public SDSS is ~50GB + 500GB of images (5TB raw) • “data” fits on a 200$ disk, 2000$ computer. • (more on that later). • THESIS: Challenging problems are publishing data providing good query & visualization tools
Time and Spectral DimensionsThe Multiwavelength Crab Nebulae Crab star 1053 AD X-ray, optical, infrared, and radio views of the nearby Crab Nebula, which is now in a state of chaotic expansion after a supernova explosion first sighted in 1054 A.D. by Chinese Astronomers. Slide courtesy of Robert Brunner @ CalTech.
BJ RF IN J H K Even in “optical” images are very different Optical Near-Infrared Galaxy Image Mosaics BJ RF IN J H K Slide courtesy of Robert Brunner @ CalTech.
Exploring Parameter SpaceManual or Automatic Data Mining • There is LOTS of data • people cannot examine most of it. • Need computers to do analysis. • Manual or Automatic Exploration • Manual: person suggests hypothesis, computer checks hypothesis • Automatic: Computer suggests hypothesis person evaluates significance • Given an arbitrary parameter space: • Data Clusters • Points between Data Clusters • Isolated Data Clusters • Isolated Data Groups • Holes in Data Clusters • Isolated Points Nichol et al. 2001 Slide courtesy of and adapted fromRobert Brunner @ CalTech.
Outline • Astronomy data • The Virtual Observatory Concept • The Sloan Digital Sky Survey
Virtual Observatoryhttp://www.astro.caltech.edu/nvoconf/http://www.voforum.org/ • Premise: Most data is (or could be online) • So, the Internet is the world’s best telescope: • It has data on every part of the sky • In every measured spectral band: optical, x-ray, radio.. • As deep as the best instruments (2 years ago). • It is up when you are up.The “seeing” is always great (no working at night, no clouds no moons no..). • It’s a smart telescope: links objects and data to literature on them.
The Age of Mega-Surveys MACHO 2MASS DENIS SDSS PRIME DPOSS GSC-II COBE MAP NVSS FIRST GALEX ROSAT OGLE ... • Large number of new surveys • multi-TB in size, 100 million objects or more • Data publication an integral part of the survey • Software bill a major cost in the survey • The next generation mega-surveys are different • top-down design • large sky coverage • sound statistical plans • well controlled/documented data processing • Each survey has a publication plan • Federating these archives Virtual Observatory Slide courtesy of Alex Szalay, modified by Jim
Virtual Observatory Challenges • Size : multi-Petabyte 40,000 square degrees is 2 Trillion pixels • One band (at 1 sq arcsec) 4 Terabytes • Multi-wavelength 10-100 Terabytes • Time dimension >>10 Petabytes • Need auto parallelism tools • Unsolved MetaData problem • Hard to publish data & programs • How to federate Archives • Hard to find/understand data & programs • Current tools inadequate • new analysis & visualization tools • Data Federation is problematic • Transition to the new astronomy • Sociological issues
3-steps to Virtual Observatory • Get SDSS and Palomar online • Alex Szalay, Jan Vandenberg, Ani Thacker…. • Roy Williams, Robert Brunner, Julian Bunn • Do some local queries and crossID matches with CalTech and SDSS to expose • Schema, Units,… • Dataset problems • the typical use scenarios. • Implement Web Service that lets you get data from both CalTech and SDSS (WSDL/SOAP/…)
Demo of Sky Server Alex Szalay of Johns Hopkins built SkyServer (based on TerraServer design). http://skyserver.fnal.gov/
Virtual Observatory and Education • In the beginning science was empirical. • Then theoretical branches evolved. • Now, we have a computational branches. • The computational branch has been simulation • It is becoming data analysis/visualization • The Virtual Observatory can be used to • Teach astronomy:make it interactive, demonstrate ideas and phenomena • Teach computational science skills
What Next?(after the data online, after the web servers) • How to federate the Archives to make a VO? • Send XML: a non-answer equivalent to “send Unicode” • “Bytes” is the wrong abstractionPublish Methods on Objects. • Define a set of Astronomy Objects and methods. • Based on UDDI, WSDL, SOAP. • Each archive is a web service • We have started this with TerraService • http://TerraService.net/ shows the idea. • Working with Caltech (Brunner, Williams, Djorgovski, Bunn) and JHU (Szalay et al) on this
SkyServer as a WebServerWSDL+SOAPjust add details Archive ss = new VOService(SkyServer); Attributes A[] = ss.GetObjects(ra,dec,radius) … ?? What are the objects (attributes…)? ?? What are the methods (GetObjects()...)? ?? Is the query language SQL or Xquery or what?
Outline • Astronomy data • The Virtual Observatory Concept • The Sloan Digital Sky Survey
Sloan Digital Sky Survey http://www.sdss.org/ • For the last 12 years a group of astronomers has been building a telescope (with funding from Sloan Foundation, NSF, and a dozen universities). 90M$. • Last year was engineer, calibrate, commission They are making the calibration data public. • 5% of the survey, 600 sq degrees, 15 M objects 60GB. • This data includes most of the known high z quasars. • It has a lot of science left in it but… that is just the start. • Now the data is arriving: • 250GB/nite (20 nights per year). • 100 M stars, 100 M galaxies, 1 M spectra. • http://www.sdss.org/ and http://www.sdss.jhu.edu/
SDSS what I have been doing • Work with Alex Szalay, Don Slutz, and others to define 20 canonical queries and 10 visualization tasks. • Don Slutz did a first cut of the queries, I’m continuing that work. • Working with Alex Szalay on building Sky Server and making data it public (send out 80GB SQL DBs)
Two kinds of SDSS data • 15M Photo Objects ~ 400 attributes 20K Spectra with ~10 lines/ spectrum
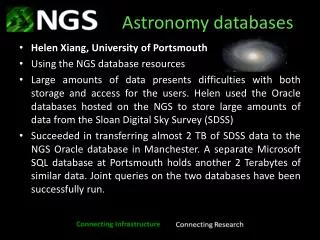
Spatial Data Access(Szalay, Kunszt, Brunner)http://www.sdss.jhu.edu/ look at the HTM link • Implemented Hierarchical Triangular Mesh (HTM) as table-valued function for spatial joins. • Every object has a 20-deep Mesh ID. • Given a spatial definition:Routine returns up to ~10 covering triangles. • Spatial query is then up to ~10 range queries. • Very fast: 10,000 triangles / second / cpu.
Q11: Find all elliptical galaxies with spectra that have an anomalous emission line. Q12: Create a grided count of galaxies with u-g>1 and r<21.5 over 60<declination<70, and 200<right ascension<210, on a grid of 2’, and create a map of masks over the same grid. Q13: Create a count of galaxies for each of the HTM triangles which satisfy a certain color cut, like 0.7u-0.5g-0.2i<1.25 && r<21.75, output it in a form adequate for visualization. Q14: Find stars with multiple measurements and have magnitude variations >0.1. Scan for stars that have a secondary object (observed at a different time) and compare their magnitudes. Q15: Provide a list of moving objects consistent with an asteroid. Q16: Find all objects similar to the colors of a quasar at 5.5<redshift<6.5. Q17: Find binary stars where at least one of them has the colors of a white dwarf. Q18: Find all objects within 30 arcseconds of one another that have very similar colors: that is where the color ratios u-g, g-r, r-I are less than 0.05m. Q19: Find quasars with a broad absorption line in their spectra and at least one galaxy within 10 arcseconds. Return both the quasars and the galaxies. Q20: For each galaxy in the BCG data set (brightest color galaxy), in 160<right ascension<170, -25<declination<35 count of galaxies within 30"of it that have a photoz within 0.05 of that galaxy. Q1: Find all galaxies without unsaturated pixels within 1' of a given point of ra=75.327, dec=21.023 Q2: Find all galaxies with blue surface brightness between and 23 and 25 mag per square arcseconds, and -10<super galactic latitude (sgb) <10, and declination less than zero. Q3: Find all galaxies brighter than magnitude 22, where the local extinction is >0.75. Q4: Find galaxies with an isophotal surface brightness (SB) larger than 24 in the red band, with an ellipticity>0.5, and with the major axis of the ellipse having a declination of between 30” and 60”arc seconds. Q5: Find all galaxies with a deVaucouleours profile (r¼ falloff of intensity on disk) and the photometric colors consistent with an elliptical galaxy. The deVaucouleours profile Q6: Find galaxies that are blended with a star, output the deblended galaxy magnitudes. Q7: Provide a list of star-like objects that are 1% rare. Q8: Find all objects with unclassified spectra. Q9: Find quasars with a line width >2000 km/s and 2.5<redshift<2.7. Q10: Find galaxies with spectra that have an equivalent width in Ha >40Å (Ha is the main hydrogen spectral line.) The 20 Queries Also some good queries at: http://www.sdss.jhu.edu/ScienceArchive/sxqt/sxQT/Example_Queries.html
An easy oneQ15: Provide a list of moving objects consistent with an asteroid. • Sounds hard but there are 5 pictures of the object at 5 different times (colors) and so can compute velocity. • Image pipeline computes velocity. • Computing it from the 5 color x,y would also be fast • Finds 2167 objects in 7 minutes, 70MBps. select object_id, -- return object ID sqrt(power(rowv,2)+power(colv,2)) as velocity from sxPhotObj -- check each object. where (power(rowv,2) + power(colv, 2)) > 50 -- square of velocity and rowv >= 0 and colv >=0 -- negative values indicate error
Q15: Fast Moving Objects • Find near earth asteroids: SELECT r.objID as rId, g.objId as gId, r.run, r.camcol, r.field as field, g.field as gField, r.ra as ra_r, r.dec as dec_r, g.ra as ra_g, g.dec as dec_g, sqrt( power(r.cx -g.cx,2)+ power(r.cy-g.cy,2)+power(r.cz-g.cz,2) )*(10800/PI()) as distance FROM PhotoObj r, PhotoObj g WHERE r.run = g.run and r.camcol=g.camcol and abs(g.field-r.field)<2 -- the match criteria -- the red selection criteria and ((power(r.q_r,2) + power(r.u_r,2)) > 0.111111 ) and r.fiberMag_r between 6 and 22 and r.fiberMag_r < r.fiberMag_g and r.fiberMag_r < r.fiberMag_i and r.parentID=0 and r.fiberMag_r < r.fiberMag_u and r.fiberMag_r < r.fiberMag_z and r.isoA_r/r.isoB_r > 1.5 and r.isoA_r>2.0 -- the green selection criteria and ((power(g.q_g,2) + power(g.u_g,2)) > 0.111111 ) and g.fiberMag_g between 6 and 22 and g.fiberMag_g < g.fiberMag_r and g.fiberMag_g < g.fiberMag_i and g.fiberMag_g < g.fiberMag_u and g.fiberMag_g < g.fiberMag_z and g.parentID=0 and g.isoA_g/g.isoB_g > 1.5 and g.isoA_g > 2.0 -- the matchup of the pair and sqrt(power(r.cx -g.cx,2)+ power(r.cy-g.cy,2)+power(r.cz-g.cz,2))*(10800/PI())< 4.0 and abs(r.fiberMag_r-g.fiberMag_g)< 2.0 • Finds 3 objects in 11 minutes • Ugly, but consider the alternatives (c programs an files and…)
Performance • Run times: on 3k$ PC (2 cpu, 4 disk, 256MB) • Some take 10 minutes • Some take 1 minute • Most take 15 seconds. • Ghz processors are fast! • (10 mips/IO, 200 ins/IO) ~100 IO/cpu sec ~5MB/cpu sec
Summary of Queries • 16 of the queries are simple • 2 are iterative, 2 are unknown • Many are sequential one-pass and two-pass over data • Covering indices make scans run fast • Table valued functions are wonderful but limitations on parameters are a pain. • Counting is VERY common. • Binning (grouping by some set of attributes) is common • Did not request cube, but that may be cultural.
Reflections on the 20 Queries • Data loading/scrubbing is labor intensive & tedious • AUTOMATE!!! • This is 5% of the data, and some queries take 1/2 hour. • But this is not tuned (disk bound). • All queries benefit from parallelism (both disk and cpu)(if you can state the query inside SQL). • Parallel database machines will do well on this: • Hash machines • Data pumps • See paper in word or pdf on my web site. • Conclusion: SQL looks good.Once you get the answers, you need visualization
Call to Action • If you do data visualization: we need you(and we know it). • If you do databases:here is some data you can practice on. • If you do distributed systems:here is a federation you can practice on. • If you do astronomy educational outreachhere is a tool for you. • The astronomy folks are very good, and very smart, and a pleasure to work with, and the questions are cosmic, so …