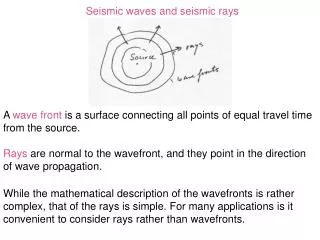
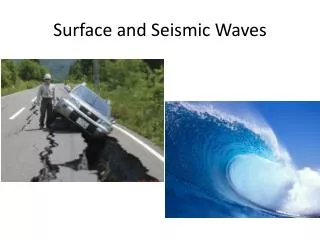
Seismic Waves
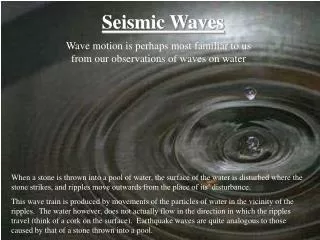
Seismic Waves. Wave motion is perhaps most familiar to us from our observations of waves on water. When a stone is thrown into a pool of water, the surface of the water is disturbed where the stone strikes, and ripples move outwards from the place of its’ disturbance.

Seismic Waves
E N D
Presentation Transcript
Seismic Waves Wave motion is perhaps most familiar to us from our observations of waves on water When a stone is thrown into a pool of water, the surface of the water is disturbed where the stone strikes, and ripples move outwards from the place of its’ disturbance. This wave train is produced by movements of the particles of water in the vicinity of the ripples. The water however, does not actually flow in the direction in which the ripples travel (think of a cork on the surface). Earthquake waves are quite analogous to those caused by that of a stone thrown into a pool.
As we have seen previously, due to tectonism, pressure or strain energy will accumulate along faults. Over hundreds of years, the built up strain energy may cause the fault to break or rupture causing the sudden loss of energy, equivalent to the snap of the board or pop of the balloon.
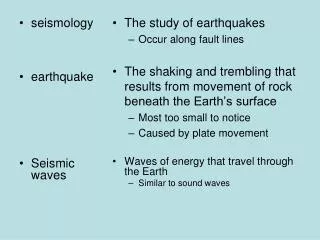
The shock radiates out from the rupture as seismic waves, which travel to the surface and produce the shaking we experience in an earthquake. There are 3 basic types: P waves (primary waves), S waves (secondary or shear waves), and surface waves.
P and S waves are called body waves because they pass directly through the Earth, whereas surface waves travel along the surface like the ripples in a pond when a stone is thrown into it. Waves traveling outwards from 1964 Great Alaskan Earthquake
A P wave is easily understood by a pool player, who “breaks” a set of pool balls arranged in a tight triangle, all touching. When the cue ball hits the other balls, the energy of striking momentarily compresses the next ball elastically. The compression is transferred to the next ball, then to the next, until the entire set of pool balls scatters around the table. P waves pass through solid, such as rock, and they can also pass through water or air. When earthquake waves pass though the air, sometimes they produce a noise.
To illustrate an S wave, tie one end of a clothesline to a tree. Hold the line tight and shake it rapidly from side to side. You can see what looks like waves running down the clothesline towards the tree distorting the shape of the clothesline. Similarly, when S waves pass through rock they distort its shape. S waves cannot pass through liquid or air, and you would not feel them aboard a ship at sea. • Because S-waves involve shearing rather than compression, they move the particles of the rock transverse to the direction of propagation. These rock motions may be in a vertical (Sv) or horizontal (Sh) plane.
Only S-waves exhibit thephenomenon called polarization. As S-waves travel through the Earth, they encounter structural discontinuities that refract or reflect them and polarize their vibrations. When an S wave is polarized so that the particles of rock move only in a horizontal plane, it is denoted by the symbol SH. When the particles of rock all move in the vertical plane containing the direction of propagation, the S wave is called an SV wave
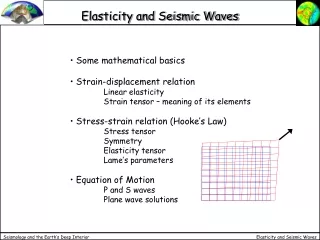
The Speed of P and S Waves The actual velocities at which P and S-waves travel depend on the densities and inherent elastic properties of the rocks through which they travel. Wave speed depends on the measures of only two elastic properties, called elastic moduli: the incompressibility (k) and the rigidity (m) of the rock. When a uniform pressure is applied to the surface of a cube of rock, its’ volume is reduced and a measure of its’ change in volume per unit volume is its; incompressibility. This type of deformation occurs when P-waves propagate through the Earth’s interior. In general, as k h,P-wave velocity h
A second type of deformation occurs when equal but opposite tangential pressures are applied to opposite faces of a cube of rock. The cube will deform by shearing out of its’ shape without any change in volume. This same strain occurs when a cylindrical core of rock is twisted by equal and opposite pressures applied at opposite ends. The greater the resistance, the greater the rigidity. Because S-waves propagate by shearing the rock, the rigidity gives a measure of their speed. In general, as mh, S-wave velocity h
The Elastic Moduli k = modulus of incompressibility (or bulk modulus) Granite – k = 27 x 1010 dyne/cm2 water – k = 2.0 x 10¹⁰ dyne/cm2 m = modulus of rigidity Granite – m = 1.6 x 10¹⁰ dyne/cm2 water – m = 0.0 dyne/cm2
Velocity Formulae P-wave velocity – a = (k + 4/3 m)/r S-wave velocity – b = m/r Where r = density of the rock through which the wave is traveling a b Granite 5.5 km/s 3.0 km/s Water 1.5 km/s 0.0 km/s
Because of the great pressures inside the Earth, the rock density increases everywhere with depth. As a consequence, it would appear that the position of the density term in the denominator of each formula would cause both the P and S-wave velocities to decrease with depth. However, both incompressibility and rigidity increase more rapidly than rock density with depth.
The rock motions that are produced when the P and S waves arrive at the Earth’s surface generate other types of seismic waves under certain conditions. These are called surface waves, and the most important of these are called Rayleigh waves and Love waves. Both types of waves travel along the surface of the Earth, with rock motions decreasing to zero with depth.
Surface waves are extremely complex. After reaching the surface, much earthquake energy will run along the surface, causing the ground to go up and down or sway from side to side. Some people caught in an earthquake have reported that they could actually see the ground moving up and down, like an ocean wave, but faster.
The Instrumental Surveillance of Earthquakes • From early times, human curiosity about the world has stimulated attempts to make measurements of natural events. Earthquake recorders are called seismographs or seismometers if they track the complete history of shaking throughout an earthquake. The earliest known seismoscope was constructed by a Chinese scholar around A.D. 132, and was designed to indicate both the occurrence of earthquake waves and their direction of approach.
By the late 1800’s the first seismographs were developed, and were very simple instruments. Even as the entire world shakes around it, a suspended mass remains stationary due to its inertia. Seismic waves can then be recorded as wiggly lines by pen and ink on paper wrapped around a rotating drum. A typical recording of an earthquake records a typical “train” of seismic waves. First the P waves, followed in succession by the S and surface waves.
An earthquake releases a complex array of waves, with great variation in frequency, which is the number of waves to pass a point in a second. A guitar string vibrates many times per second, but it takes successive ocean waves many seconds to reach a waiting surfer. The ocean wave has low frequency, and the guitar string vibrates at a high frequency. An earthquake can be compared to a symphony orchestra, with many instruments producing sound waves that vibrate at both high and low frequencies. A seismologist can separate out the complex waveforms into simple sinusoidal components using high-speed computers. High frequency = Low frequency Complex waveform Sinusoidal Components
As we have seen, S waves are slower than P waves, and seismologists use this fact to tell how far away it is from the seismograph to the earthquake. The seismograph records the P wave first, then the S wave. If the seismologist knows the speed of each wave, then by knowing that both waves started at the same time it’s possible to work out how far the earthquake waves have traveled to reach the seismograph.
If we can determine the distance of the same earthquake from several different seismograph stations, we are able to locate the epicenter, the point on the Earth’s surface directly above the earthquake focus.
Focal Depth • The focus or hypocenter is the point beneath the Earth’s surface where the crust or mantle first ruptures to cause an earthquake. The depth of the earthquake below the surface is called its focal depth. Hypocenter
Measuring an Earthquake Magnitude • The size of an earthquake was once measured largely on the basis of how much damage was done. This was unsatisfactory to Caltech seismologist Charles Richter, who wanted a more quantitative measure of earthquake size, at least for southern California. Charles Richter, inventor of the magnitude scale.
Charles Richter has explained that: "Magnitude can be compared to the power output in kilowatts of broadcasting station. Local intensity on the Mercalli scale is then comparable to the signal strength on a receiver at a given locality; in effect the quality of the signal. Intensity like signal strength will generally fall off with distance from the source, although it also depends on the local conditions and the pathway from the source to the point."
Following earlier work by the Japanese, in 1935 Richter established a magnitude scale based on how much a seismograph needle was deflected by a seismic wave generated by an earthquake about 60 miles (100 km) away. Complicating matters, Richter’s scale is logarithmic, which means that an earthquake of magnitude 5 would deflect the needle of the seismograph ten times more than an earthquake of magnitude 4.
In order to calculate the magnitude of an earthquake, one must first determine the distance to the epicenter by finding time difference between arrival of the first P wave and first S wave, and measuring the amplitude (or height) of the highest seismic wave recorded. These values are then plotted on a nomogram, and the earthquake magnitude is then read off the nomogram.
Magnitude Classes • Earthquakes are often divided into classes according to their magnitude: Great; M > =8Major; 7 < =M < 7.9Strong; 6 < = M < 6.9Moderate: 5 < =M < 5.9Light: 4 < =M < 4.9Minor: 3 < =M < 3.9Micro: M < 3
Earthquakes release a tremendous amount of energy, which is why they can be so destructive. The table below shows magnitudes with the approximate amount of TNT needed to release the same amount of energy. Magnitude Approximate Equivalent TNT Energy 4.0 1010 tons 5.0 31800 tons 6.0 1,010,000 tons 7.0 31,800,000 tons 8.0 1,010,000,000 tons 9.0 31,800,000,000 tons
For earthquakes that occurred between about 1890 (when modern seismographs came into use) and 1935 when Charles Richter developed the magnitude scale, people went back to the old records and compared the seismograms from those days with similar records for later earthquakes. For earthquakes prior to about 1890, magnitudes have been estimated by looking at the physical effects (such as amount of faulting, landslides, sandblows or river channel changes) plus the human effects (such as the area of damage or felt reports or how strongly a quake was felt) and comparing them to modern earthquakes. Many assumptions have to be made when making these comparisons. For example, how do you compare the shaking for people living in log cabins or tents in the early 1800's with shaking for people living in high-rise steel and concrete buildings (with waterbeds!) in the 1990's? Because different researchers can get widely varying magnitudes from using different assumptions on how to make these comparisons, many of the old earthquakes have big differences in the magnitudes assigned to them. For example, magnitude estimates for the quakes that occurred near New Madrid, Missouri in 1811 and 1812 vary from the upper magnitude 6 range to as high as 8.8, all because of the choices the researchers made about how to compare the data.
An increase one magnitude unit represents about a 30-fold increase in release of stored-up seismic strain energy. So the Hector Mine Earthquake of magnitude 7 in the Mojave Desert on October 16, 1999 would be the equivalent of about thirty earthquakes the size of the Whittier Narrows Earthquake of October 1, 1987, which was magnitude 6. Ground rupture, Hector Mine Earthquake Damage caused by Whittier Earthquake
Richter never claimed that his magnitude scale, now called local magnitude and labeled ML, was an accurate measure of earthquakes. Nevertheless, the Richter magnitude scale caught on with the media and the general public, and it is still the first thing a reporter asks a professional about an earthquake: “How big was it on the Richter scale?”
Compare the fault area of the magnitude 7.3 (top) with that of the magnitude 5.6 (smallest one near the bottom). • The Richter magnitude scale works reasonably well for small to moderate-size earthquakes, but it works poorly for very large earthquakes, the ones we call great quakes. For these, other magnitude scales are necessary.
In this same way, low frequency earthquake waves can be recorded thousands of miles away from the earthquake source. A commonly used earthquake scale is the surface wave magnitude, or MS, which measures the largest deflection (amplitude) of the needle on the seismograph for a surface wave that has a frequency of about 20 seconds. • To record earthquakes at seismographs thousands of miles away, seismologists had to use long-period (low frequency) surface waves, because the high frequency waves die out a few hundred miles away from the epicenter. To understand this problem, think about how music is heard a long distance away from its source. Far away all you can usually make out are the very deep, or low-frequency, bass tones which transmit through the air more efficiently than the treble (high-frequency) notes.
The magnitude scale most useful to professionals is the moment magnitude scale, or MW, which comes closest to measuring the true size of an earthquake, particularly a large one. This scale relates magnitude to the area of the fault that ruptures and the amount of slip that takes place on the fault. For large earthquake, this can be done by measuring the length of the fault which ruptures at the surface and figuring out how deep the zone of aftershocks extends, thereby calculating the area of rupture. The amount of slip can be measured at the surface as well.
For small to intermediate-size earthquakes, the magnitude scales are designed so that there is relatively little difference between Richter magnitude, surface-wave magnitude, and moment magnitude. But for large earthquakes, the difference is dramatic. For example, both the 1906 San Francisco Earthquake and the 1964 Alaska Earthquake had a surface-wave magnitude of 8.3. However, the San Francisco Earthquake had a moment magnitude of only 7.7, whereas the Alaska Earthquake had a moment magnitude of 9.2, which made it the second largest earthquake of the 20th century. San Francisco Earthquake, 1906 Alaska Earthquake, 1964
Acceleration Acceleration, Velocity, Displacement (Image courtesy of Charles Ammon, Penn State) When you step on the accelerator in the car or put on the brakes, the car goes faster or slower. When it is changing from one speed to another, it is accelerating (faster) or decelerating (slower). This change from one speed, or velocity, to another is called acceleration. During an earthquake when the ground is shaking, it also experiences acceleration. The peak acceleration is the largest acceleration recorded by a particular station during an earthquake.
g g is the acceleration of gravity 9.8 (m/s2) or the strength of the gravitational field (N/kg) (which it turns out is equivalent). G is the proportionality constant 6.67x10⁻¹¹ (N-m2/kg2) in Newton's law of gravity. On the other hand, the force of gravity, or F = mg, at the surface of the earth, or F = GMm/r^2 at a distance r from the center of the earth (where r is greater than the radius of the earth). When there is an earthquake, the forces caused by the shaking can be measured as a percentage of gravity, or percent g.
These are maps of peak ground acceleration (measured in % g) and peak ground velocity (measured in cm/sec) for the 1994 Northridge earthquake. As we will see, the damage caused by an earthquake is strongly tied to both PGA and PGV.
Intensity • Measuring the size of an earthquake by the energy it releases is all well and good, but it’s still important to measure how much damage it does at critical places. This measurement is called earthquake intensity, which is measured on the Abridged Modified Mercalli (MM) Scale. Developed by Giuseppe Mercalli, the scale ranges from Roman numeral I to XII, with I being generally not felt, to XII which means total damage. Giuseppe Mercalli, developer of the Mercalli Intensity Scale.
The Abridged Modified Mercalli (MM) Intensity Scale (1956 version) • Not felt. Marginal and long-period effects of large earthquakes. • Felt by persons at rest, an upper floors, or favorably placed. • Felt indoors. Hanging objects swing. Vibration like passing of light trucks. Duration estimated. May not be recognized as an earthquake. • Hanging objects swing. Vibration like passing of heavy trucks; or sensation of a jolt like a heavy ball striking the walls. Standing cars rock. Windows, dishes, doors rattle. Glasses clink. Crockery clashes. In the upper range of IV, wooden walls and frames creak. 0.015 – 0.02g. • Felt outdoors; direction estimated. Sleepers wakened. Liquids disturbed, some spilled. Small unstable objects displaced or upset. Doors swing, close, open. 0.03 – 0.04g. • Shutters, pictures move. Pendulum clocks stop, start, change rate. 0.06 – 0.07g. • Felt by all. Many frightened and run outdoors. Persons walk unsteadily. Windows, dishes, glassware broken. Knickknacks, books, etc. off shelves. Pictures off walls. Furniture moved or overturned. Weak plaster and masonry D cracked. Small bells ring (church, school). Trees, bushes shaken visibly, or heard to rustle. 0.10 – 0.15g. • Difficult to stand. Noticed by drivers. Hanging objects quiver. Furniture broken. Damage to masonry D, including cracks. Weak chimneys broken at roof line. Fall of plaster, loose bricks, stones, tiles, cornices, also unbraced parapets and architectural ornaments. Some cracks in masonry C. Waves on ponds, water turbid with mud. Small slides and caving in along sand or gravel banks. Large bells ring. Concrete irrigation ditches damaged. 0.25 – 0.30g. • Steering of cars affected. Damage to masonry C; partial collapse. Some damage to masonry B; none to masonry A. Fall of stucco and some masonry walls. Twisting. fall of chimneys, factory stacks, monuments, towers, elevated tanks. Frame houses moved on foundations if not bolted down; loose panel walls thrown out. Decayed piling broken off. Branches broken from trees. Changes in flow or temperature of springs or wells. Cracks in wet ground and on steep slopes. 0.50 – 0.55g. • General panic. Masonry D destroyed; masonry C heavily damaged, sometimes with complete collapse; masonry B seriously damaged. General damage to foundations. Frame structures, if not bolted. shifted off foundations. Frames racked. Serious damage to reservoirs. Underground pipes broken. Conspicuous cracks in ground. In alluviated areas sand and mud ejected, earthquake fountains, sand craters. Greater than 0.60g. • Most masonry and frame structures destroyed with their foundations. Some well-built wooden structures and bridges destroyed. Serious damage to dams, dikes, embankments. Large landslides. Water thrown on banks of canals, rivers, lakes, etc. Sand and mud shifted horizontally on beaches and flat land. Rails bent slightly. • Rails bent greatly. Underground pipelines completely out of service. • Damage nearly total. Large rock masses displaced. Lines of sight and level distorted. Objects thrown into the air.
Masonry A. Good workmanship, mortar, and design; reinforced especially laterally, and bound together by using steel, concrete, etc.; designed to resist lateral forces. Masonry B. Good workmanship and mortar; reinforced. but not designed in detail to resist lateral forces. Masonry C. Ordinary workmanship and mortar, no extreme weaknesses like failing to tie at corners, but neither reinforced nor designed against horizontal forces. Masonry D. Weak materials, such as adobe; poor mortar; low standards of workmanship; weak horizontally. Earthquake intensities are based on a post-earthquake survey of a large area: damage is noted, and people are questioned about what they felt. An intensity map is a series of concentric lines, irregular rather than circular, in which the highest intensities are generally, but not always, closest to the epicenter of the earthquake.
The Mercalli intensity scale is also useful in “predicting” what might happen given a scenario earthquake. Since ground conditions and building types are known for a given location, given an earthquake of a certain magnitude, it is possible to determine the Mercalli intensities at that location. The above scenario is for a theoretical magnitude 7.4 earthquake on the southern San Andreas fault. Computer calculated Mercalli intensities are color coded for easier recognition.
As mentioned, it is possible to relate earthquake intensity to the maximum amount of ground acceleration (peak ground acceleration, or PGA) that is measured with a special seismograph called a strong-motion accelerograph. This is shown on the previous MMI scale. Acceleration is measured as a percentage of the Earth’s gravity. A vertical acceleration of 1 g would be just enough to lift you (or anything else) off the ground. Obviously this would have a major impact on damage done by an earthquake at a given site. Intensity map for the 1994 Northridge earthquake. Note that damage is strongly related to both PGA and PGV at the bottom of the map.
Fault Plane Solutions In the early days of seismology, it was enough to locate an earthquake accurately and to determine its magnitude. But seismic waves contain much more information, including the type of faulting. The seismogram shows that the first motion of an earthquake P wave is either a push toward the seismograph or a pull away from it. With the network of seismographs in California, its possible to determine the push or pull relationship at many stations, leading to information about whether the earthquake was on a reverse fault, a normal fault, or a strike-slip fault. 1st motion of P wave up is a compression (push) towards the seismograph 1st motion of P wave down is an extension (pull) away from the seismograph
The first motions of P waves show which way the fault moved during an earthquake. E E C C C C C C E E E C = Compression E = Extension
For a left lateral strike-slip fault, the fault plane solution will look like this. The circle, or “beach ball”, is actually a 2-D representation of a 3-D fault zone, with the red areas indicating areas in compression, the white being areas in extension. Fault plane Fault plane Auxiliary plane Areas in extension Areas in compression Note that a secondary, or auxiliary plane is also present in these cases.
Typical Fault Plane Solutions Strike-Slip Fault Thrust Fault Normal Fault Right-lateral Left-lateral • Many earthquakes are not accompanied by surface faulting, so the fault-plane solutions are the best evidence of the type of fault causing the earthquake.
Can you figure out what created the following two fault plane solutions? Hints: Records a compression everywhere Records an extension everywhere
Aftershocks Aftershock zones can be defined in two different ways... An aftershock is actually just a normal earthquake in every physical detail. Out of context, there is no way to tell the difference between any arbitrary earthquake and an "aftershock". The only real difference between the two is that an aftershock follows closely in the wake of a larger earthquake, and in roughly the same location as its predecessor. That larger, initial earthquake is usually referred to as the "mainshock". More specifically, there are two guidelines for labelling an earthquake as an aftershock. First, it must occur within an "aftershock zone." This is sometimes defined as within one fault-rupture length of the mainshock rupture surface, or alternatively, within an area defined by seismologists based upon early aftershock activity. Second, it must occur within that designated area -- the "aftershock zone" -- before the seismicity rate in that area returns to its "background", meaning pre-mainshock, level. If an earthquake meets these two criteria, seismologists consider it an "aftershock."