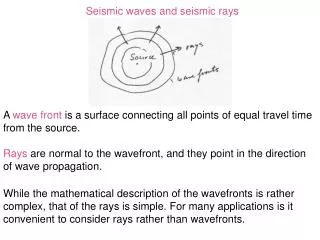
Seismic Waves: P-Waves, S-Waves, Velocities, and Earth's Interior
Learn about seismic waves, their types, velocities, and the Earth's interior structure. Discover how P-waves and S-waves behave, the impact of seismic velocities, and attenuation effects. Explore the refraction, reflection, and conversion of seismic waves in different Earth layers. Gain insights into shadow zones and wave propagation with real-world examples like the Japan earthquake of 2011.

Seismic Waves: P-Waves, S-Waves, Velocities, and Earth's Interior
E N D
Presentation Transcript
Seismic waves Mathilde B. Sørensen and Jens Havskov
Seismiske bølger • Two types of waves : • body waves • surface waves
Body waves P-waves S-waves P-waves are faster then S-waves
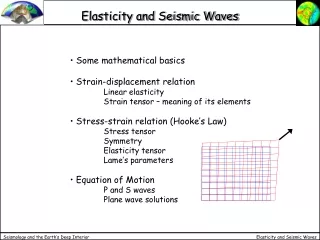
Stress and deformation • Stress = force/area • Depends on both force and area of contact • Stress is measured in Pascal = N/m2 = kg/(m∙s2) • Types: compression, dilatation and shear • Strain = Deformation = Δl/l0 • Change in size and form • Has no dimension, given in % • Types: compression, expansion and shear
Seismic velocities The velocity of P and S waves depend on the elastic modulesμ and K and of the density ρ
Elastic modules Describes the relation between stress and strain module = stress/strain Elastic materials need two modules to describe this relations: Bulk modulos K Shear modulus μ
Elastic modules Bulk modulus K is a measure of how easy it is change the volume of a media. At a pressure P, the relative change in volume V is proportinal to K. Volume V New volume V-ΔV
Elastic modules Shear μ is a measure on how easy it is to change the shape of a media. At a shear stress of Ps , the shear deformartion dθ is proportianl with the stress by the factor μ. dθ Note: Liquids have no shear strength so μ=0
Seismic velocities P- and S- waves deform the media they pass in different ways. Their velocitites will therefore depend on the constants K and µ in different ways. In addition they both depend on density ρ: A P-wave gives both volume and shear deformation and its velocity will therefore depend on both K and µ. An S-wave only makes shear deformation and the velocity is therefore independent of K.
Seismic waves on a seismogram The constants K and µ are always positive so the the P-wave veleocity is always larger than the S-wave velocity. P-waves will therefore arrive first when we record them on a seismogram. SeismogranSeismogram
Seismic velocities and the Earths interior If seismic waves enter a material where the shear modulus is 0, the P-velocity will decrease and there will be no S-waves. Lack of S-waves in the Earth’s outer core and the reduction of the P-wave velocity here, lead to the conclusion that this part of the Earth is liquid.
Velocity discontinuities Moho: Crust to mantle~7 km under oceans, ~30-60 km under continentsIncrease in Vp from 6.0 km/s til 7.6 km/s Low velocity zone (LVZ):At ca. 100 km depthCaused by partial melting 400 km and 660 km:Defines transition zone between outer and inner mantle.Probably caused by phase changes.
EUROPROBE project web Seismic velocites in the crust Moho Profile along Trans European Suture Zone, central Europe
6 5 4 3 2 1 0 2 4 6 8 10 1 Attenuation • Causes: • Geometrical spreading: The energy is spread as it moves away. Amplitude proportional to 1/R where R is distance. • Anelastic absorbtion: The amplitude descrease due to friction in the material and the energy is converted to heat. Quantified by constant Q. The amplitude of seismic waves decrease as they move away from the seismic source
Attenuation Wave amplitude for a damped harmonic oscillator
Converted phases A P-wave incident on a boundary between two layers will be split in 4 different rays. A reflected P, reflected S, refracted P and refracted S. The angle of the rays to the normal is calculated by Snell’s lov i1 v1 v2 i2 v1 < v2
Snell’s law and converted phases • Snell’s law is valid also for converted • phases, e.g. P to S • Reflected • Refracted S-Ray P-Ray P-Ray i2S i1P v1P v1S < v1P i1P v2P < v1P v2S < v2P P-Ray i2S i2P S-Ray
Ray, in a model with linearly increasing velocity with depth, is along a circle Velocity = K x Z
Seismic rays in the Earth bend due to velocity increase with depth
Seismic rays in the Earth Seismic rays passing the Earth will be reflected, refracted and converted at the layer boundaries. P: P-wave in the mantleS: S-wave in the mantleK: P-wave in the outer liquid coreI: P-wave in the central solid core J: S-waves in the central solid corec: Reflection from outer core
Shadow zone S-waves cannot pass the liquid outer core There is thereforw a shadow zone where direct S-waves are not observed S-shadow zone is affecting rays found at distances larger than 103°
Shadow zone for P P-waves are much slower through the outer core than through the mantle They are therefore refracted towards the center of the Earth and there is a shadow zone where P is not observed P-shadow zone is between 103° og 143°
Travel time for a seismic P-wave through the Earth ca. 5 min? ca. 20 min? ca. 45 min? ca. 90 min?
Globale recordings of the Japan earthquake in 2011 Antipode Near the earthquake
Wave propagation along the surface The movie illustrates the up-and-down velocity of the Earth's surface. Strong blue waves indicate the surface is moving rapidly downward. Strong red waves indicate rapid upward motion. February 27, 2010, M=8.8. Time is min:sec. global.shakemovie.princeton.edu/
Travel time curves are obtained from earthqueke recordings • The different phases reflect the layering of the Earth • The interior structure of the earth has been determined by inverting the travel time cureves to structure Travel time curves and Earth structure
Structure determinations: Seismic tomography Differencees between observed and calculated travel times for seismic rays can be used to determine variations the structure of the Earth. Can be used on both a local and global scale
Ray paths in 2 D Slowness is 1/velocity
Mantle tomography Variation in seismic velocity in the mantle in a section from Europe to Japan. The higher velocity (and colder) subduction plates are clearly seen. Subdiction zone Subdiction zone
Global tomography The variation in velocity is less then 2 %
Receiver function analysis Receiver function analysis requires earthquake recordings at teleseismic distances (more then 3000 km) on broad band seismometers. The epicenters must be distributed in different directions around the stations.
Conclusion Seismology is the main science for studying the interior of the Earth Structural studies can be both local and global It is essential to be able to identify seismic phases in structural studies