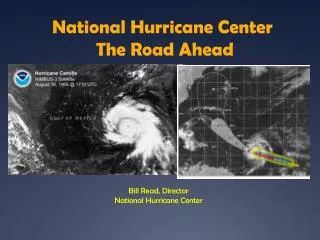
Long Term Trends in National Hurricane Center Watches and Warnings
Long Term Trends in National Hurricane Center Watches and Warnings Mark DeMaria, NOAA/NESDIS/StAR, Fort Collins, CO and James L. Franklin, NOAA/NCEP/TPC, Miami, FL Presented at the Interdepartmental Hurricane Conference March 8, 2007 Outline Introduction Data and Verification Methods

Long Term Trends in National Hurricane Center Watches and Warnings
E N D
Presentation Transcript
Long Term Trends in National Hurricane Center Watches and Warnings Mark DeMaria, NOAA/NESDIS/StAR, Fort Collins, CO and James L. Franklin, NOAA/NCEP/TPC, Miami, FL Presented at the Interdepartmental Hurricane Conference March 8, 2007
Outline • Introduction • Data and Verification Methods • 1963-2006 sample • Verification and Long Term Trends • Conclusions
Hurricane Watches and Warnings • Watch – hurricane conditions are possible within 36 hours • Warning – hurricane conditions are expected within 24 hours • Watches and Warnings (WWs) re-evaluated every 6 hours • Can be updated at any time in special advisories • End points of WWs selected from coastal “breakpoints”
Input to Watches and Warnings • Major considerations • Forecast track, intensity, wind structure • Forecast uncertainty • Larger area included than receives hurricane winds • Other factors • Time of day • 5 PM warnings preferred over 11 PM • Storm surge and evacuation lead times • Input from coordination call
Data and VerificationMethods • All WW breakpoints for contiguous U.S. digitized for 1965-2006 • Cindy 1963 and Cleo 1964 also included • 183 coastal breakpoints used to define coastline • Supplemented with 157 intermediate points • Brownsville, Texas to Eastport, Maine = 3600 nmi • “Observed” hurricane winds from NHC data • NHC best track position, intensity • Operational 64 kt wind radii • Best track radii since 2004
Breakpoint 2 Breakpoint 1 “Observed” Hurricane Wind Region
WW Length and Lead Time • WW Length • Size of WW for an individual advisory • Total length with WW at any time in storm lifetime • WW Lead Time • Time between first issuance of WW and arrival of hurricane winds • Valid only for points that received hurricane winds
Lengths of Hurricane Warnings from Individual Advisories1963-2006 N=890
Top Five Warning Lengths • Gloria 1985 Sep 27 1053 nmi • Floyd 1999 Sep 16 1045 nmi • Bob 1991 Aug 18 984 nmi • Charley 2004 Aug 13 906 nmi • Belle 1976 Aug 10 838 nmi
Storm-Average Warning Lead Time(time from when warning was first issued at a location to arrival of hurricane winds)
Hurricane Watch Length and Lead TimeDecadal Averages Length Lead Time
Warning and Watch Statistics(2000-2006) • Average individual warning length 290 nmi • Average storm-total warning length 362 nmi • Average storm-total length w\ hurricane winds 89 nmi • Prob. of warned point receiving hurricane winds 25% • Lead time of hurricane warning 34 hr • Average individual watch length 210 nmi • Average storm-total watch length 425 nmi • Average storm-total length w\ hurricane winds 85 nmi • Prob. of watch point receiving hurricane winds 20% • Lead time of hurricane watch 50 hr
Conclusions • The average length of NHC hurricane warnings has decreased in the 2000’s reversing a 35 year trend of increases • Average warning length is 290 nmi • The average lead times of warnings and watches are now 34 hr and 50 hr • Long-term averages are 27 hr and 40 hr • Warned location has 1 in 4 chance of hurricane winds • Watch location has 1 in 5 chance of hurricane winds