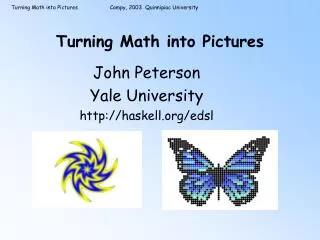
Turning Math into Pictures
Turning Math into Pictures John Peterson Yale University http://haskell.org/edsl Welcome! You’ll need to know a few things for this session: Math: coordinates on a plane, functions, graphs Computers: using Windows and editing text files

Turning Math into Pictures
E N D
Presentation Transcript
Turning Math into Pictures John Peterson Yale University http://haskell.org/edsl
Welcome! You’ll need to know a few things for this session: • Math: coordinates on a plane, functions, graphs • Computers: using Windows and editing text files If you don’t have much experience with these things please pair up with a more experienced student!
Making Pictures We will make pictures by writing computer programs that turn basic mathematics into pictures. Our goal is for each student (or team) to make three pictures. We will place these on a web page for everyone to see when this session is over. Please ask questions at any time!
Using Pan# As I talk I will show you sample picture programs. I’d like you to run these yourself as I’m talking so you won’t fall asleep. And you can also change these programs a little bit to see what happens or fiddle with the controls if you’re bored. Let’s see how to run and edit a program.
Displaying a Picture All you need to do is open (click on) a .pan file to view the picture it describes. Please look in the folder “pictures” on your desktop and click on the picture labeled “01-welcome” Note that there are controls which govern the picture. Play with these a little. Now save the picture on your disk with the “save as” selection on the File menu.
Writing a Program Now, let’s write a program to make a picture. Use the text editor and write the following: picture (r @ a) = if even(r/10) then white else green Save this in the file test.pan
Running a Program To run a program, open (double click) the test.pan file. What happens when you run this program? If you make any mistakes entering the program you’ll get a message when you open it. You should go back to the editor to fix the problem, close the window with the message, and try again.
Demos When I have an image on a slide or some code that has a file name under it you will find that file in the “pictures” directory. You can run the demo while I’m talking to see what happens 02-star.pan
Extending a Language You already know two languages: English and Mathematics. We want to have a language that includes Mathematics and pictures too. Let’s think about how we extend (add new words to) English to see how we can extend Mathematics.
What’s this mean? “Fred gave me his zax”
What’s this mean? “Fred gave me his zax” I’m stumped too! So what should we do?
Looking up a new word… “Fred gave me his zax” From a dictionary: n. a tool similar to a hatchet, used for cutting and dressing roofing slates.
Building Language Aha! We can make a language bigger by giving definitions to new words. The new word is a name for some new concept. Mathematicians use definitions to create new words (names) all the time. These definitions express new words in terms of ones you already know.
Computer Languages A computer language is just like any other language except a computer knows what you’re saying. Computers are very fussy! If you write down something that’s wrong (bad spelling, misplaced punctuation, total nonsense) it will complain.
Functions One more thing: definitions often are parameterized. That is, they contain names that are “filled in” when the definition is used. Such a definition is a function. Definition: the midpoint of a line between points A and B is a point on the line, C, such that the distance from A to C is the same as the distance from B to C.
Notation The computer wants you to write down definitions in a very particular way: name parameters = body pi = 3.14159 increment x = x + 1 plusTwo x = increment (increment x) midpoint a b = (a + b)/2 We don’t use parenthesis for function calling; f x instead of f(x)
Types and Logic There are a lot of ways to “mess up” in a language: Typing Mistakes: Fred ga?ve mehis z.ax Illogical sentences: “Have a zax day!” Since zax is a noun this doesn’t make sense. Mathematicians use logic to tell whether a sentence is gibberish or OK. Types (like “noun”) describe a set of objects. I’m sure the computer will occasionally complain about the syntax or types in your programs. Logic will help us understand things better.
About Pan# A program is like a dictionary. It is a set of definitions, each starting in the leftmost column, in any order you want. There is a built-in vocabulary that you use to build new definitions A program must define the name “picture” so that when you run it the viewer knows what you want to see.
Everything is a Function Functions can be used to represent all sorts of things. We’re going to use functions to represent pictures. Every function has a domain (sorts of things that “go in” to the function) and a range (sorts of things that “come out” of the function. For pictures, our domain is (a piece of) the coordinate plane and our range is colors. That is, a picture is something that tells you “if you look here, you’ll see this color”
Coordinates A coordinate is something that “points to” a place on the plane. A coordinate is like a house address - it tells you how to find a place. Coordinate systems have an origin - a point in the center of the plane from which other points are located.
Rectangular Coordinates Rectangular coordinates are written as (x,y), where x is the projection of the point onto the x axis and y is the projection of the point onto the y axis. y P (4,2) 2 4 x
Polar Coordinates There is another way to express coordinates on the plane: polar coordinates. These use a distance, d, and a direction, angle, to locate a point from the origin. d angle We write this as (d @ angle) in our language. The angle is measured in radians - these are sort of like degrees except they go from 0 to 2p (or -p to p)
Some Questions If you are standing at the origin of the coordinate system and someone told you to go to (x,y) how would you go there? What if they told you to go to (d @ a)?
Coordinates in Pan# The usual coordinate system in Pan# uses “pixels” (those little dots that make up your display) to measure distance. The origin is in the center of the display window. You can see these two coordinate systems in action in your demos: 03-rectangular.pan 04-polar.pan
Colors We describe colors using 3 numbers, each between 0 and 1 Amount of Red Amount of Green Amount of Blue Example: Yellow = Red + Green rgb 1 1 0 Play with colors a minute using 05-showColor.pan to see what a color looks like
A Picture! We can define a simple picture like this: picture(d @ a) = if d < 50 then black else white What will this picture look like? The “if - then - else” allows you to choose one of two colors
An Interactive Picture! r <- slider “Select r” (0,100) 50 picture(d @ a) = if d < r then black else white The “slider” allows you to see how the picture changes as “r” changes. 06-icircle.pan
Regions A region is a function that tells you whether a point is in the region or not. So the circle in the last example is a region. You could write this as circ (d @ a) = d < r picture p = if circ p then black else white We’ll separate the program into regions and a “region painting” function.
Regions A region is a function that tells you whether a point is in the region or not. So the circle in the last example is a region. You could write this as circ (d @ a) = d < r picture p = if circ p then black else white We’ll separate the program into regions and a “region painting” function. A region
Regions A region is a function that tells you whether a point is in the region or not. So the circle in the last example is a region. You could write this as circ (d @ a) = d < r picture p = if circ p then black else white We’ll separate the program into regions and a “region painting” function. Painting the region
Striping We want to draw stripes! Let’s control • Distance between stripes (pixels) • Width of the stripe (fraction) We need a special function to do this: floor(x) is the greatest integer less that x. floor (2.34) = 2 floor (9.99) = 9 floor (-0.1) = ???
Striping We compute the fractional part of x/width. Where is this 0? frac x = x - floor x stripes width size x = frac ((x + width/2)/width) < size p <- slider "Distance between stripes" (0, 100) 20 w <- slider "Stripe width (fraction)" (0,1) 0.5 picture (x,y) = if stripes p w x then black else white 07-stripes.pan
Combining Regions We can make functions that glue regions together in different ways. How would you make a function that forms the union of two regions?
Region Union A point “p” is in the union of r1 and r2 if it is in r1 or r2. orRegion r1 r2 = \p -> r1 p || r2 p Don’t worry if this seems hard to follow! We won’t have to write functions to do things with regions - they are already defined for you. this is “or” region looks here
Region Functions Here are the built-in regions functions: andRegion: points in both regions orRegion: points in either region xorRegion: points in just one region rMinus: points in the first but not the second region invertRegion: points outside a region
Combining Regions Let’s take the functions like “orRegion” out for a test drive … vstripes (x,y) = stripes 20 0.3 x hstripes (x,y) = stripes 20 0.3 y circ (d @ a) = d < 70 r = orRegion vstripes hstripes picture p = if r p then black else white 08-orRegion.pan
Combining Regions Some more regions to try … you can remove the -- in front of these lines to test them. r = andRegion vstripes hstripes r = xorRegion vstripes hstripes r = invertRegion circ r = rMinus vstripes circ 09-andRegion.pan 10-xorRegion.pan 11-invertRegion.pan 12-rMinus.pan
Polar Stripes Striping in polar coordinates is pretty cool! What do you think these regions look like? r (d @ a) = stripes 20 0.3 d r (d @ a) = stripes (2*pi/20) 0.5 a 13-circles.pan 14-pies.pan
Fancy Painting There’s no need to just use black and white. Paint with any color you want. Paint more than one region. Use rgb to make exotic colors. Here’s an example: r1 (x, y) = stripes 40 0.3 x r2 (x, y) = stripes 40 0.3 y r3 (d @ a) = stripes 25 0.7 d r4 = orRegion r1 r2 -- the whole grid r5 = andRegion r1 r2 -- the intersections c1 = rgb 1 0.9 0 -- yellowish orange picture p = if r5 p then blue else if r4 p then red else if r3 p then c1 else white 15-paint.pan
Moving Regions We can move regions around! This function takes a region and shifts its center to a new point: moveR (xc,yc) r = \(x,y) -> r (x-xc, y-yc) Read this as “point (x,y) is in the moved region if point (x-xc,y-yc) is in the original region.”
Op Art Here’s a program with interference patterns: d <- slider “Distance” (0, 50) 20 circles (d @ a) = stripes 10 0.5 d twoCircles = orRegion circles (moveR (d, 0) circles) picture p = if twoCircles p then black else white 16-opart.pan
Activity 1 Make a picture using regions. Here are some ideas: • Make some fancy regions by combining the simple ones we’ve seen in new ways. • Think of new ways to define regions. Can you make squares or diamonds or ovals? • What happens when you stripe something like (x+y) or (x*x)? • Use many different colors to paint your regions. • Use rgb to make fancy colors • Move some regions around to create interference patterns • Use sliders!
Fades We’re going to try something with animations now! A fade turns one picture into another. You see a lot of these in TV and the movies. We’ll make fades that last exactly 1 second. To make things easy the two pictures will always be in the square between -1 and 1.
Region Based Fading We can simplify the problem by using a region to control the fade. This region should not touch the square at t=0 and cover the entire square at t=1. r t (x,y) = x < 2*t-1 picture <- fadeRegion r 17-simplefade.pan Evaluate the region at t = 0 and t = 1 to make sure things work right!
Blinds Let’s reuse our stripes function to make a fade: r t (x,y) = stripes 0.1 t x picture <- fadeRegion r 18-stripedfade.pan Check the region at t=0 and t=1 to make sure!
Interpolation Fading is a form of interpolation. In general, interpolation takes two objects and a number between 0 and 1 and returns an object between the two endpoints. We can use the following built-in interpolations: interpolateC t color1 color2 interpolateN t number1 number2 interpolateP t point1 point2 What is the formula for interpolateN? That first example could be rewritten as r t (x,y) = x < interpolateN t (-1) 1
Color Interpolation We can interpolate colors directly. This should be very familiar! fader im1 im2 t p = interpolateC t (im1 p) (im2 p) picture <- fadeImage fader 19-colorfade.pan
Another Fader Here’s a “head scratcher”! Can you figure it out? fader im1 im2 t (x,y) = if abs x > t || abs y > t then im1 (x,y) else im2 (x/t, y/t) 20-squeezer.pan Note: abs x is the distance to the origin || is “or”
Activity 2 Write your own fader. Some ideas: Use an interesting region based on polar coordinates Use two different kinds of interpolation Use point interpolation to move a region Use color interpolation to soften the edge of a region Intersect regions that are formed by lines. Change the rate of time flow
Funny Faces We can use functions to alter a picture from your disk. This “outside” picture is a function just like the ones that you display. This program just displays the selected picture: thePicture <- image “Select a picture” picture = thePicture 21-picture.pan