FlowGraph: A Compound Hierarchical Graph for Flow Field Exploration
220 likes | 400 Vues
FlowGraph: A Compound Hierarchical Graph for Flow Field Exploration. Jun Ma, Chaoli Wang, Ching-Kuang Shene Michigan Technological University Presented at IEEE Pacific Visualization Symposium 1 March 2013 Sydney, Australia. Occlusion and clutter challenge

FlowGraph: A Compound Hierarchical Graph for Flow Field Exploration
E N D
Presentation Transcript
FlowGraph: A Compound Hierarchical Graph for Flow Field Exploration Jun Ma, Chaoli Wang, Ching-Kuang Shene Michigan Technological University Presented at IEEE Pacific Visualization Symposium 1 March 2013 Sydney, Australia
Occlusion and clutter challenge Poor scaling from 2D flow to 3D flow Possible to reduce but impossible to eliminate Prevent occlusion-free observation and comparison of streamline relationships Visual exploration challenge Streamlines are difficult to pick in 3D Difficult to observe streamlines and their spatial relationships in a controllable fashion Challenges for 3D streamline visualization
Flow Web [Xu and Shen 2010] Nodes are spatial regions that are hierarchically organized Edges indicate the number of particles traveling in between Do not store information about streamline clusters Queries such as identifying streamline bundles become a trial-and-error process Our FlowGraph Explicitly store information about streamline clusters Extend Flow Web to a compound graph representation Allow full exploration of streamline clusters, spatial regions and their interconnections Flow Web vs. FlowGraph
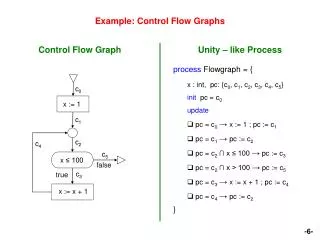
Orange square: R-node Yellow circle: L-node
Two kinds of nodes R-nodes (spatial regions) Spatial regions partitioned in an octree manner Stop the top-down partitioning if the flow entropy is smaller than a given threshold L-nodes (streamline clusters) Streamline clusters organized hierarchically Group spatially neighboring and geometrically similar streamlines in a bottom-up manner (more detail to come) FlowGraph definition (1)
Three kinds of weighted edges R-R edges Record the number of common streamlines shared between two R-nodes at the same level of the space hierarchy L-L edges Record the number of common leaf-level regions traversed in order between two L-nodes at the same level of the streamline hierarchy L-R edges Record the number of streamlines in the L-node passing through the R-node between a L-node and a R-node FlowGraph definition (2)
Signature of L-node (12, 10, 9, 6, 5, 2, 1) (1, 2, 3, 5, 6, 9, 10, 11, 12) • For a single streamline: record a sequence of the leaf-level regions the streamline traverses in order • For a group of streamlines: record a set of the leaf-level regions traversed by all streamlines without ordering
Streamline similaritybetween two streamlines l1 and l2 (for leaf level L-nodes) Longest common subsequence (LCS) of the signatures of l1 and l2 Mean of the closest region distances (MCR) of the signatures of l1 and l2 Streamline cluster similaritybetween two streamline clusters c1 and c2 (for non-leaf level L-nodes) Shared set (SS) of the signatures of c1 and c2 Mean of the closest region distances (MCR) of the signatures of c1 and c2 Streamline hierarchy construction
Time and storage cost It takes up to 15 minutes and the required storage is less than 40MB
Apply a force-directed graph layout algorithm to draw FlowGraph in 2D How to update the graph during hierarchical exploration? Apply a triangulation to the underlying coarsest level of the graph Consider a set of additional forces to reposition the nodes to Reduce the overlap Maintain the topology FlowGraph drawing (1)
FlowGraph drawing (2) Orange square: R-node Yellow circle: L-node
Standard exploration Hierarchical exploration Brushing and linking Filtering and querying Specific to FlowGraph Path comparison Region comparison Graph transition Path illustration FlowGraph exploration
FlowGraph Address intrinsic difficulty when visualizing and understanding 3D streamlines and their spatial relationships Extract essential information from flow data to enable analytics reasoning facilitated by interactive visual interface Future work Tackle time-varying flow fields: pathlines (4D to 2D) Acknowledgements U.S. National Science Foundation Summary