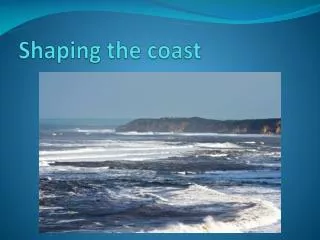
The Coast
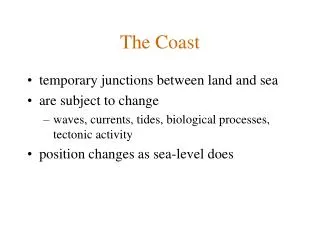
The Coast. temporary junctions between land and sea are subject to change waves, currents, tides, biological processes, tectonic activity position changes as sea-level does . Sea level 18,000 years ago during last ice age. If sea level rises 60cm (20ft).

The Coast
E N D
Presentation Transcript
The Coast • temporary junctions between land and sea • are subject to change • waves, currents, tides, biological processes, tectonic activity • position changes as sea-level does
Red areas will flood in about 100-200 years • Blue areas may flood over several centuries • http://www.epa.gov/climatechange/effects/coastal/slrmaps_sealevelmap.html
Over the next century, sea level is most likely to rise 55-60 cm along most of the U.S. Atlantic • Red areas would flood during spring high tides • http://www.epa.gov/climatechange/effects/coastal/slrmaps_ne_liny.html
Sea Level Rise Does Matter • Superstorm Sandy produced record storm surge levels for locations in and around the NY City metropolitan region • Sea levels have risen more than a foot in the New York City region since the Industrial Revolution. • So what difference did this extra foot make for the citizens of New York City? Quite a lot. 6,000 more people impacted for each inch of rise! • 70,929 more people and 30,551 more homes flooded. • According to Dr. Ben Strauss, Chief Operating Officer and Director of the Program on Sea Level Rise at Climate Central
Beaches • a zone of loose particles that covers part of the shore • extends from a landward limit • cliff, permanent dunes, seawall • extends to the seaward limit where movement of sediment on and offshore ceases
Beach Profiles • Steepness of beaches change with seasons and storms • Summer and calm periods build up beaches • Swash dominates (soaks into beach), less backwash • Winter and storms erode and flatten beaches • Backwash dominates, very little swash soaks in because beach is saturated)
Figure 10.2a • Wide berm • Steep beach face
Figure 10.2d • Narrow berm • Flatter beach face • longshore bar
Seasonal Changes on a beach in California • Fig. 11-13c, p. 254
Before and After Sandy • Long Branch, NJ • Mantoloking, NJ
Before and After Sandy • Cupsogue Beach, Westhampton, NY • Fire Island Nat’l Seashore
Beaches • exist in a delicate balance between accumulation and destruction • Waves can transport sand onshore or offshore • Longshore currents transport sand along the coastline
Barrier Islands • Are essentially large sand bars • Protect the coast behind them • Very unstable themselves
Figure 10.9 • Tom’s River, NJ
Barrier Island Migration • Figure 10.10
Human Impact on Beaches • Attempts to “save” beaches or property often fail or make matters worse
Figure 10.19 • Shipbottom, NJ
Groin Field Cape May, NJ
Figure 10.21 • Santa Cruz Harbor, CA
Break water Santa Monica, CA
Designed to protect harbors from waves • Can cause excessive erosion, requiring dredging to keep area stable
Alternative: Beach Replenishment