Download
1 / 38
380 likes | 576 Vues
MESOSCALE CYCLOGENESIS OVER THE FAR EASTERN SEAS: STUDY WITH THE USAGE OF SATELLITE RADIOPHYSICAL MEASUREMENTS Irina A. Gurvich, Leonid M. Mitnik, Maya L. Mitnik V.I. Il’ichev Pacific Oceanological Institute, FEB RAS Vladivostok, 690041, Russia, e-mail: gurvich@poi.dvo.ru.

E N D
MESOSCALE CYCLOGENESIS OVER THE FAR EASTERN SEAS: STUDY WITH THE USAGE OF SATELLITE RADIOPHYSICAL MEASUREMENTSIrina A. Gurvich, Leonid M. Mitnik, Maya L. MitnikV.I. Il’ichev Pacific Oceanological Institute, FEB RASVladivostok, 690041, Russia, e-mail: gurvich@poi.dvo.ru
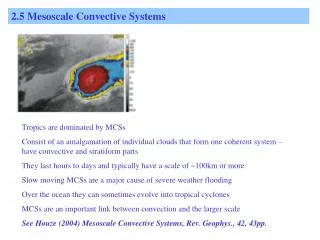
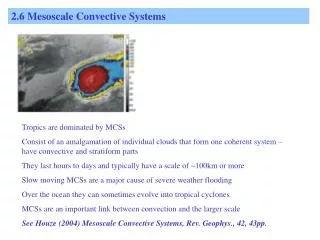
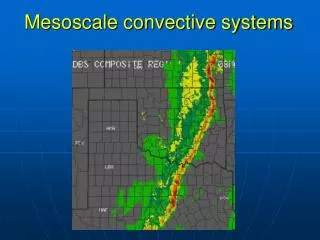
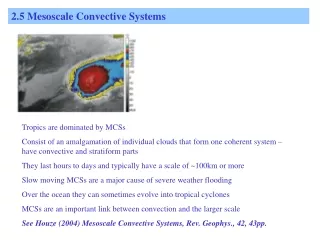
Mesoscale atmospheric convective vortices over the seas are one of the worst studied meteorological objects. Horizontal scales of the mesoscale vortices vary from one hundred to one thousand kilometers and life time duration – from several hours till 2-3 days. They can be responsible for unexpected and frequently not predicted weather deterioration that threatens to transport and fishery operation at the sea.These features in combination with the sparse meteorological observations hinder their revealing in pressure field on the surface analysis map. Thus remote sensing of the atmosphere-ocean system is indispensable for diagnosis and forecasting of the mesoscale vortices. Satellite infrared and visible images provide the detailed presentation on cloud system of mesoscale vortices and are the basis for tracing their evolution. Quantitative information on the atmospheric and oceanic parameters in the mesoscale vortex area can be obtained from passive and active microwave measurements.
The purpose of this work is investigation of structure and characteristics of mesoscale vortices over the Okhotsk and West Bering Seas by analysis of the Envisat ASAR images, the Aqua AMSR-E brightness temperatures Тbs and fields of the total atmospheric water vapor content V and total cloud liquid water content Q retrieved from Тbs.
Sensors,satellites and data • • Promising sources of regularly available remotely sensed data to the MCs study are the AquaAdvanced Microwave Scanning Radiometer (AMSR-E), the QuikSCAT Seawindsscatterometer and Terra and Aqua MODISspectroradiometer. All these sensors are characterized by a wide swath and possess improved spatial resolution and/or have additional spectral channels compare to such sensors as the SSM/I, AMSU, AVHRR, etc. • One more active sensor, a wide swath Envisat Advanced Synthetic Aperture Radar (ASAR) can contribute the high-resolution near-surface wind field.
AMSR observation concept Advanced Microwave Scanning RadiometerAMSR is an 8-frequency total-power microwave radiometer with dual polarization (except two vertical channels in the 50-GHz band).AMSRhas a conical scanning geometry. Incidence angle is 55 deg.
Approach • Probe MVs evolution and structure using: • - Terra and Aqua MODIS visible/IRimages, NOAA IR images (cloudiness) • - AquaAMSR-E brightness temperatures(water vapor content and cloud liquid water) • - QuikSCATSeaWinds and EnvisatASAR (surface wind) • -Surface analysis,absolute topography and temperature field maps from JMA and KMA, absolute topography, temperature and SSTreanalyses from NCEP-NCAR NOAA. • Case studies: • Okhotsk and West Bering Seas. Cold period 2006, 2007.
Bering Sea Intensification of air-sea interaction and formation of mesoscale rolls and cells during cold air outbreaks over the Northwest Pacific Okhotsk Sea Kamchatka Aqua MODIS 20 Nov 2004 02:15 Мезомасштабный циклогенез над ДВ морями наиболее активен в осенне-зимний период.
Favorable conditions for mesoscale cyclogenesis Almost stationary upper-air trough or depression and thermal trough. Air temperature at 500-hPa height is -(40 – 45)°C. Малоподвижная высотная ложбина или депрессия и термическая ложбина или замкнутый очаг холода с температурой воздуха на изобарической поверхности 500 мб от -40 до -45°С
Favorable conditions for mesoscale cyclogenesis Бароклинность в пограничном слое атмосферы. Термическая асимметрия на картах АТ925 и АТ850 в северо-западной части Охотского моря. Low-level baroclinicity
Favorable conditions for mesoscale cyclogenesis Большие градиенты ТПО, обусловленные близостью ледяного покрова или холодного материка. Large SST gradients along theice edge or cold land.
Favorable conditions for mesoscale cyclogenesis Поле приземного давления в районе формирования мезовихря характеризуется стационарной ложбиной или периферией гребня или ядра высокогодавления. Surface analysis. Almost stationary trough or periphery of high-pressure area.
Areas of mesoscale cyclogenesis over the Okhotsk and West Bering Seas. На формирование мезовихрей существенное влияние оказывают и орографические факторы. Этим объясняются характерные районы их зарождения.
Envisat ASAR23:50 UTC 6 Dec 6-7 December 2006.Okhotsk Sea. Kamchatka KMA surface analysis, AT500, AT850 and NCEP-NCARSST reanalysis 00 UTC 7 Dec Градиентная зона (АТ850) способствовала усилению северо-восточного ветра в зал. Шелихова.
Kamchatka Kamchatka ASAR 23:50 6 Dec MODIS 02:00 7 Dec Mesoscale vortex near western Kamchatka (size of MV ≈ 300 km, d of MV center ≈ 80 km)
ASAR 23:50 6 Dec Поле ветра, восстановленное по данным скаттерометра QuikSCAT за 19:05 Гр 6 и 8:06 Гр 7 декабря. Мезовихрь смещался к югу с осью ложбины, за 12 часов опустившись почти на 2° долготы. Kamchatka Kamchatka Kamchatka QuikSCAT winds on 6 Dec at 19:05 UTC (left) and on 7 December at 08:06 UTC (right) and Envisat ASARimage (center) on 7 December at 23:50 UTC.
MODIS 02:00 7 Dec Вариации яркости на изображении РСА с полным разрешением (фрагмент)демонстрируют неоднородность шероховатости в центральной маловетренной области вихря. Видна вихреобразная структура линии сдвига, а также вихревые цепочки, поперечные волны и мелкие конвективные ячейки в центральной области вихря в поле облачности и приводного ветра. Kamchatka Fragment of ASAR full resolution image showing variations of sea surface wind into the MV center Kamchatka
MODIS 02:00 7 Dec В зоне более слабых ветров между линией сдвига и побережьем Камчатки на изображении РСА c полным разрешением хорошо видны отпечатки мелких конвективных ячеек и гряд (фрагмент), которые на видимом изображении не просматриваются. Kamchatka Fragment of ASAR full resolution image Kamchatka Small-scale cellular convection between the shear wind zone and Kamchatka coast.
02:00 UTC Поле яркостных температур на изображении Aqua AMSR-E.Области слабых градиентов ветра в центре вихря и к западу от камчатского побережья соответствует сухой воздух на микроволновом изображении, а участкам с наиболее высокой яркостной температурой – конвективная облачность и вариации яркости в поле приводного ветра на изображении РСА. Kamchatka Kamchatka Kamchatka Aqua MODIS 02:00 UTC Envisat ASAR 23:50 6 Dec Aqua AMSR-E 89 GHz H polarization
19 December 2006. Okhotsk Sea Cold air outbreak and mesovortex on TerraMODIS image taken on 02:15 UTC. Length of its cloud band ≈ 400 km. Dark rectangle marks the Boundaries of Envisat ASAR image taken at 00:13 UTC Мезовихрь на фоне холодного вторжения на видимом изображении. Длина его облачной полосы около 400 км.
ASAR 00:13 UTC AMSR-E 02:25 UTC NOAA-17 00:21 UTC Warm core and mesoscale convective features within the centre (d = 70-80 km) Kamchatka Kamchatka Sikora T.D. and all. Synthetic aperture radar as a tool for investigating polar mesoscale cyclones. Weather and Forecasting, 2000, V. 15, 745-758. Young G.S. and all. Use of synthetic aperture radar in finescale surface analysis of synoptic-scale front at sea. Weather and Forecasting, 2005, V. 20, 311-327.
Envisat ASAR 11:40 UTC 11 February 2007 Okhotsk Sea Okhotsk Sea KMA surface analysis, upper-air maps and NCEP-NCAR SST reanalysis12 UTC 11 Feb 2007 Ice Ice
Ice Sakhalin 11 February 2007. Okhotsk Sea Envisat ASAR 11:40 UTC Мезовихрь в форме запятой у ледовой кромки в центральной части Охотского моря длиной по горизонтали примерно 380 км. Длина вихреобразных структур вдоль линии сдвига ветра в среднем составляет 35 км. Ice Aqua MODIS IR 16:55 UTC Aqua AMSR-E 16:55 UTC Comma cloud near the ice edge
Surface manifestation of dry convection in the sea surface roughness on ASAR image(left). Cloud cells are absent on visible image(right). Проявления сухой конвекции на изображении РСА, которые в поле облачности отсутствуют.
Water vapor content and cloud liquid water content from AMSR-E data
ASAR 00:24 UTC Ice Ice Okhotsk Sea 29 January 2007 KMA surface analysis, AT500 and NCEP-NCAR SST reanalysis 00 UTC 29 Jan 2007 No indication of MV
Envisat ASAR 00:24 UTC 29 Jan 2007 QuikSCAT wind 19:31 UTC 28 Jan 2007 ice Cyclonic circulation is evident on sea wind map
28 January 2007 Mesovortex formation JMA AT500and NCEP-NCAR AT925and air temperature reanalysis. 00 UTC 28 January 2007 Red dots indicate the location of vortex centers
28 January 2007 Mesovortex formation NOAA-18 17:28 UTC NOAA-17 01:39 UTC NOAA-17 11:24 UTC
ASAR 00:24 UTC Aqua AMSR-E 02:15 UTC Aqua MODIS 02:15 UTC Kamchatka Kamchatka Okhotsk Sea 29 January 2007 d ≈ 180 km
Kamchatka Kamchatka Kamchatka Mature polar low at NW Bering Sea15 January 2006 Aqua MODIS at 00:50 UTC, JMA surface analysis and NCEP-NCAR SST reanalysis on15 Jan 2006at 00 UTC Полярный циклон в Беринговом море в максимальной стадии развития. На карте приземного анализа отсутствует. Спиральная структура облачной системы циклона с концентрическим безоблачным «глазом» в центре.
Convergence of sea surface winds and cyclonic circulation Мезомасштабная циклоническая циркуляция и конвергенция в поле приводного ветра, восстановленном по данным скаттерометра QuikSCAT. Kamchatka Kamchatka Aqua MODIS for 00:50 UTC 15 Jan 2006. Visible image. QuikSCATfor 18 UTC 14 Jan 2006
Structure of polar low Aqua AMSR-E 00:55 UTC Size of PL ≈ 160-170 km Diameter of PL eye ≈15 km. Kamchatka “EYE” Aqua MODIS 00:55 UTC visible Cloudiness field
Aqua MODIS 00:55 UTC Water vapor and cloud liquid water
Filling polar low at NW Bering Sea15 January 2006 JMA surface analysis, AT700 and NCEP-NCAR SST reanalysis 12 UTC 15 Jan 2006 Envisat ASAR 10:21 UTC Полярный циклон смещался на северо-восток соскоростью≈ 15 км/час, приближаясь к суше и заполняясь.
Polar low evolution on ASAR, IR and TB(89H) images Aqua MODIS IR 14:25 UTC Aqua AMSR-E 14:25 UTC Мезовихрь стадии заполнения. Облачная система, сохраняя спиральную структуру, приобрела форму овала, «глаз» в его центре стал менее выраженным. Область слабых ветров в центральной части расширилась по площади, вдоль ее внутренней границы появилась облачная полоса, состоящая из цепочки вихреобразных структур (2) длиной около 10 км . Крупные дождевые ячейки видны на всех трех изображениях, Envisat ASAR 10:21 UTC
Water vapor and cloud liquid water Полное содержание водяного пара и капельной влаги в области мезоциклона по сравнению со стадией максимального развития уменьшилось на 1 и 0,3 кг/м2 соответственно. Aqua MODIS IR image for 14:25 UTC
As a whole, satellite passive and active sensing at different ranges provided more complete and comprehensive information on evolution of mesoscale vortices that, in turn, has a special importance for analysis and forecasting as well as for validation of cloud-resolving numerical models. Данные спутниковых активных и пассивных измерений в совокупности обеспечивают четкое представление о зарождении, перемещении и эволюции мезовихрей, а также о скорости ветра и интенсивности осадков в зоне их влияния. Они представляют интерес как для анализа и прогноза МВ и связанных с ними опасных явлений, так и для проверки результатов численного моделирования.