Download
1 / 13
130 likes | 277 Vues
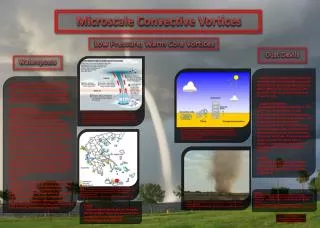
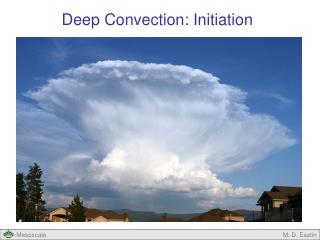
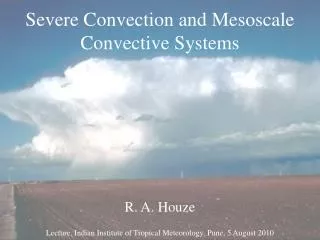
Convection Initiation Near Mesoscale Convective Vortices. Christopher A. Davis and Stanley B. Trier National Center for Atmospheric Research Boulder, Colorado, USA. Global View of MCCs (MCVs?). 60-h Radar Composite Animation (00 UTC 11 June – 12 UTC 13 June, 2003).

E N D
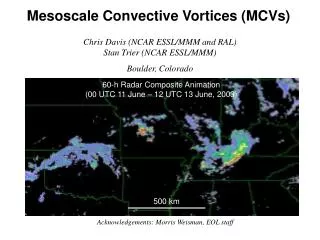
Convection Initiation Near Mesoscale Convective Vortices Christopher A. Davis and Stanley B. Trier National Center for Atmospheric Research Boulder, Colorado, USA
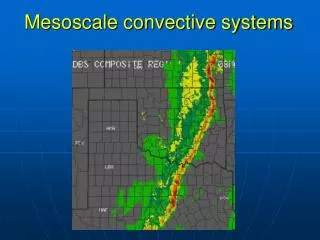
60-h Radar Composite Animation (00 UTC 11 June – 12 UTC 13 June, 2003)
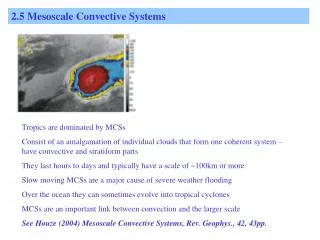
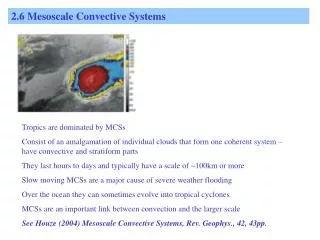
Mesoscale Convective Vortices • Produced within organized convection • Dynamically balanced • Longevity depends on initiating new convection • Potential for QPF skill enhancement • Lifting and moistening above the PBL: a mesoscale imprint
Bow Echo and MCV Experiment (BAMEX) NRL P-3 20 May – 6 July, 2003 WMI Lear Jet NOAA P-3 NRL P-3 MIPS
150 km IOP 1 IOP 4 IOP 5 1500 UTC 24 May 0600 UTC 1 June 1100 UTC 5 June X X X X IOP 8 IOP 15 MCV Origins X X X 0600 UTC 11 June 0500 UTC 29 June
IOP 5 Mean Wind Profile 800 hPa dBz 2120 UTC 5 June 70 60 50 40 30 20 10 Locally Unstable T(ºC) m/s
Mean Wind Profile IOP 15 750 hPa 2050 UTC 29 June dBz 70 60 50 40 30 20 -3º 10 Widespread Instability m/s
IOP 8 Mean Wind Profile 900 hPa 1730 UTC 11 June dBz 70 60 50 X 40 30 20 10 Widespread Instability m/s
Balance of MCVs Average Tinside RMW – Toutside RMW Thin line: balanced; Heavy line: obs Based on nonlinear balance Tv’ (K) Tv’ (K)
Vertical Motion and Vertical Displacement:Idealized Simulations • Vertical Velocity (Turquoise < -3; Blue – 1 to –3; Orange 1 to 3; Red > 3 cm/s) • Vertical Displacements (200-m contour interval, negative values dashed) • Curves with arrowheads denote back trajectories from max upward displacement area • X denotes approximate vortex center Trier et al. 2000, Mon. Wea. Rev.
Summary • Vortex-induced vertical displacement imprints mesoscale organization of convection • Convection downshear • Subsidence upshear • Balanced vortices amenable to data assimilation • Convective initiation points: coupling between PBL and mesoscale features.