Understanding Convective Initiation in the Eastern US: A Satellite Image Analysis
This analysis delves into convective initiation (CI) processes in the eastern United States, utilizing visible satellite imagery. The study highlights the diurnal cycle of convection, emphasizing afternoon activities in the Rockies and Southeast, alongside nocturnal patterns over the Gulf and Great Plains. It explores factors influencing CI, including lapse rate dynamics, moisture convergence, and the impact of mesoscale circulations. Key figures illustrate concepts such as CAPE, CIN, and the role of atmospheric layers in facilitating or inhibiting convection during specific conditions.

Understanding Convective Initiation in the Eastern US: A Satellite Image Analysis
E N D
Presentation Transcript
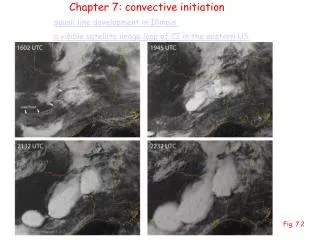
squall line development in Illinois a visible satellite image loop of CI in the eastern US Chapter 7: convective initiation 35°N 103°W Fig. 7.2
35°N 103°W 97.5°W 92°W Fig. 7.10
diurnal cycle of convective precip • Afternoon convection in the Rockies and Southeast • Nocturnal convection is prevalent over the Gulf & Gulf Stream, and in a broad swath of the Great Plains. time UTC JJA 108.8°W 40°N 35°N average rainfall frequency (June-August 1996-2006) source: http://locust.mmm.ucar.edu/episodes/Hovmoller David Ahijevych
annual cycle of lower-tropospheric stability & BL moisture across N America at 35°N Fig. 7. 1: numbers refer to months (1 … 12)
7.1 CI requisitesunderstanding destabilization: lapse rate tendency equation First law of thermodynamics
Fig. 7.4: term I: shown is the 700-500 mb T difference. Larger differences are advected from the NW into Texas. Fig. 7.5: term II: effect of vertical lapse rate advection plotted on a skew T. Fig. 7.6: term I + III: effect of differential horizontal temp. advection Fig. 7.7: term IV: effect of stretching Fig. 7.8: term V: effect of latent heat release.
equilibrium level severe benign LFC no convection convective inhibition
sensitivity of CAPE / CIN to choice of “parcel” surface-based CAPE / CIN mixed-layer CAPE / CIN
how to derive the MU CAPE (most unstable CAPE) shaded area: MU CAPE WLR: wet-bulb lapse rate deep convection source layer
destabilization without lapse rate changes: the effect of LL moisture & heating, and the lifting of a potentially-unstable layer three ways to remove CIN: LL convergence, CBL deepening adding water vapor to the CBL CBL heating (sfc sensible heat flux) note that LL moistening & warming not only reduce CIN, but also increase CAPE Fig. 7. 9
potential instability, layer lifting, and convective initiation Lifting a potentially unstable layer yields CAPE potential instability: or
Typical wet-season tropical sounding qe* d < 0 Conditional instability: dz
7.2 Mesoscale circulations and boundaries affecting CI Fig. 7.11: Sea breeze, HCR’s, and convective initiation (CI) Atkins et al. 1995 CI may occur along single boundaries, or at intersections between boundaries, or between boundaries and HCRs Fig. 7.16: Horizontal convective rolls & CI (Weckwerth et al 1996)
3D structure of boundaries: core/gap, cleft & lobe, misocyclones, and CI Fig. 7.12 and 13 (based on the paper by Marquis, Richardson, Markowski 2007)
another example of BL variability due to mesoscale circulations and boundaries gravity wave ridges old outflow boundary dryline
predicting CI from a sounding real parcel? Tw The key reason why the parcel may follow the dashed black curve is entrainment, mainly as soon as a shallow Cu cloud forms. Note the very dry air above the BL. The shallow Cu will be diluted by the dry air, and the Cu temperature will cool towards the wet-bulb T (Tw) of the mixed air.
CI failure Fig. 7.15: CI failure. The Forth Worth sounding suggest no CIN, plenty of CAPE. CI did occur further north. Misocyclones (Marquis et al 2007)
destruction of embryonic convection by shear wind profile wind profile wind profile wind profile tick marks every 2 km on x axis every 1 km on z axis Fig. 7.20 and 21
7.3 Moisture convergence & CI • changes in mixing ratio by moisture convergence in flux form: • Most model Cu parameterization schemes use resolved moisture convergence & stability changes as arguments. They may not capture the fine-scale structure of mesoscale boundaries.