Download

1 / 17
170 likes | 198 Vues
The SATCAST system aids in real-time forecasting of convective storms, crucial for aviation safety. Utilizing geostationary satellite data, it identifies pre-convective initiation signs for timely alerts and mitigation. Developed to address the limitations of numerical models in predicting convective weather, this system combines GOES satellite imagery with radar data for accurate analyses and predictions. By monitoring specific thresholds and time trends in satellite data, the algorithm can detect the onset of convective storms, providing valuable insights for meteorological forecasting and aviation operations.

E N D
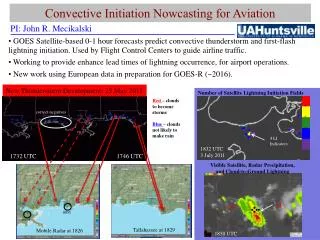
Automated Geostationary Satellite Nowcasting of Convective Initiation: The SATellite Convection AnalySis and Tracking (SATCAST) System John Mecikalski1 Kristopher Bedka2 1 University of Alabama-Huntsville 2 Cooperative Institute for Meteorological Satellite Studies (CIMSS), UW-Madison NWS Training Slides Prepared: 6 August 2006 NWS Training Slide Set John R. Mecikalski, UAH
Motivation • Numerical models have significant problems “nowcasting” location/intensity of convective weather phenomena in the 0-6 hour time frame • This is especially true over oceanic regions where poor initialization results in incorrect location/intensity forecasts for convective storms • Since little real-time satellite-derived data is available in airplane cockpits, coupled with NWP deficiencies, mid-flight convective storm initiation and growth represents a significant hazard for aviation interests • A major portion of the accidents from aircraft turbulence encounters are within close proximity to atmospheric convection (Kaplan et al, 1999) • The cost of diverted flight can be as high as $150,000 and a cancellation close to $40,000, depending on the size of the plane (Irrgang and McKinney, 1992) NWS Training Slide Set John R. Mecikalski, UAH
Motivation (cont’d) • The NASA sponsored Advanced Satellite Aviation weather Product (ASAP) initiative was started to better infuse satellite data into FAA Aviation Weather Research Program (AWRP) product development teams' (PDT's) aviation weather diagnostics and forecasts • Geostationary satellites provide excellent coverage (both spatial and temporal) of regions prone to convective storms (60° S – 60° N) • - Since one can see the development of convection in satellite imagery, we sought to develop an algorithm to identify pre-convective initiation signatures and nowcast new convective initiation in real-time • - Convective Initiation: The first detection of significant precipitation echoes (> 30 dBz) from cumulus clouds by ground-based radar NWS Training Slide Set John R. Mecikalski, UAH
Datasets USE McIDAS to acquire and process: • GOES-12 1 km visible and 4-8 km infrared imagery every 15 mins - CI nowcasting techniques can be applied to any high-resolution (≤ 4 km) geostationary satellite sensor where satellite-derived winds are available - IR data interpolated to the 1 km visible resolution for direct relationship between IR and VIS analysis techniques • UW-CIMSS visible/IR satellite derived winds for cloud motion assessment - Winds used to track cumulus features back in time for cloud-top trend estimates • WSR-88D base reflectivity composite used for real-time validation - Composite also interpolated to the 1 km VIS resolution (not shown) NWS Training Slide Set John R. Mecikalski, UAH
Evaluation of Pre-CI Satellite Signatures • Integrate GOES satellite and WSR-88D radar imagery • - Identified GOES IR TB and multi-spectral technique thresholds and time trends present before convective storms begin to precipitate • - Studied numerous real-time and archived convective events with diverse mesoscale forcing regimes and thermodynamic environments [continental (U.S. Great Plains) to sub-tropical (S. Florida)] • - Leveraged upon documented satellite studies of convection/cirrus clouds [Roberts and Rutledge (2003), Ackerman (1996), Schmetz et al. (1997), Inoue (1987)] • - After pre-CI signatures are established, test on other independent cases to assess algorithm performance NWS Training Slide Set John R. Mecikalski, UAH
CI Interest Field Criteria CI Interest Field Critical Value 10.7 µm TB (1 score) < 0° C < -4° C/15 mins < -2° C/5 mins (GOES-11) ∆TB/30 mins < ∆TB/15 mins ∆TB/10 mins < ∆TB/5 mins (GOES-11) 10.7 µm TB Time Trend (2 score) Within prior 30 mins Within prior 10 mins (GOES-11) Timing of 10.7 µm TB drop below 0° C (1 score) 6.5 (or 6.7) - 10.7 µm difference (1 score) -35° C to -10° C 13.3 - 10.7 µm difference (1 score) 12.0 - 10.7 µm difference -25° C to -5° C -3° C to 0° C (GOES-11) 6.5 (or 6.7) - 10.7 µm Time Trend (1 score) > 3° C/15 mins 13.3 - 10.7 µm Time Trend (1 score)12.0 - 10.7 µm Time Trend > 3° C/15 mins > 1° C/5 mins (GOES-11) From RR03 NWS Training Slide Set John R. Mecikalski, UAH
May 4, 2003 Convective Event • Slow-moving spring storm produced 90 tornadoes across Kansas, Missouri, Tennessee, and Arkansas • Western KS and NE convection produced mainly wind/hail damage NWS Training Slide Set John R. Mecikalski, UAH
Convective Cloud Mask • The foundation of the CI nowcast algorithm…only calculate IR fields where cumulus are present • Utilizes time of day/year dependent brightness thresholding, brightness gradients, and brightness standard deviation techniques • Collaboration with Dr. Udaysankar Nair (UAH) to implement statistical pattern-recognition based cumulus detection method by summer 2004 NWS Training Slide Set John R. Mecikalski, UAH
Multi-Spectral Band Differencing • Compared multi-spectral techniques with co-located WSR-88D imagery to identify difference thresholds for cumulus in a pre-CI state • 3.9 - 10.7 technique for cloud-top microphysics (Ellrod: WF 1995, Setvak and Doswell: MWR 1991) not used due to variation of 3.9 µm radiance with solar angle NWS Training Slide Set John R. Mecikalski, UAH
“Per-Pixel” Cloud-Top Cooling Estimates 15 min ΔTB • Study of colocated GOES-8 10.7 µm TB and radar reflectivity pixel trends for stationary convective clouds along the Colorado Front Range • Found that - 4°C/15 mins (- 8°C/15 mins) corresponds to weak (vigorous) growth • B”By monitoring via satellite both the cloud growth and the occurrence of subfreezing cloud-top temperatures, the potential for up to 30 min advance notice of convective storm initiation (> 35 dBz), over the use of radar alone, is possible” Roberts and Rutledge, Weather and Forecasting (2003) NWS Training Slide Set John R. Mecikalski, UAH
Satellite-Derived Offset Vector (SOV) Technique U=10 ms-1 u=U * cos() = 7.07 ms-1 pixel_x=(u*( t))/x =~6 pixels v=U * sin() = 7.07 ms-1 pixel_y=(v*( t))/y =~6 pixels Current Tb= - 50°C Tb=20°C Tb= - 40°C Tb=20°C Per Pixel Differencing SOV Differencing Tb= - 70°C Tb= - 10ºC Tb= 60°C Tb= - 10ºC t-15 mins 235º @ 10 ms-1 ~1 km NWS Training Slide Set John R. Mecikalski, UAH
Satellite-Derived Wind Analysis 850 hPa Analysis (winds in kts) • 4 images at 15 min frequency used for winds: Visible, 6.5 µm, and 10.7 µm • - Reduced effect of NWP model background to better capture unbalanced mesoscale flows (i.e. anvil expansion, lower tropospheric outflow boundaries) • Barnes analysis used to interpolate winds to ~1 km visible resolution • - Wind field over 3 layers established (1000-700, 700-400, 400-100 hPa); height assignment based on 10.7 µm TB and NWP model temperatures NWS Training Slide Set John R. Mecikalski, UAH
Cloud-Top Cooling Estimates: Moving Cumulus 1930 UTC 2000 UTC NWS Training Slide Set John R. Mecikalski, UAH
2000 UTC All CI Interest Fields 10.7 μm Fields Only No Anvil 2030 UTC 2100 UTC CI Nowcast Algorithm • Nowcasts captured convective development well across eastern and north-central Kansas • Conservative cloud growth threshold (4° C/15 mins) can lead to greater false alarm occurrences • Detailed analysis reveals lead times up to 45 mins NWS Training Slide Set John R. Mecikalski, UAH CI Threshold
2030 UTC 2100 UTC 2130 UTC CI Nowcast Algorithm: June 12th IHOP • Since 5 min GOES-11 data was used, time trend thresholds are cut in half, resulting in noisy nowcasts for quasi-stationary convection in New Mexico • TX Panhandle/OK convective development captured well NWS Training Slide Set John R. Mecikalski, UAH
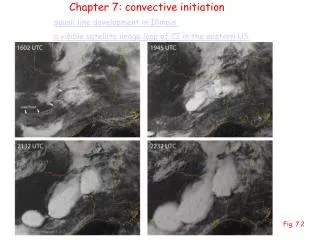
CI Nowcast Algorithm: August 3, 2003 1815 UTC 1715 UTC 1745 UTC • Complex convective forcing from upper-level cold core cyclone, combined with lake breeze circulation • Although noisy at first glance, CI over central/western IL identified up to 1 hour in advance • Objective validation methodology very difficult to develop NWS Training Slide Set John R. Mecikalski, UAH
Conclusions • Through: 1) identification of VIS cumulus clouds, 2) calculation of IR multi-spectral techniques, 3) tracking of cumulus cloud movement, and 4) estimation of IR cloud-top time trends, We have demonstrated skill in nowcasting CI and identifying growing cumulonimbus at 30-45 min lead times using current generation geostationary imagery • Mecikalski, J. M., and K. M. Bedka: “Forecasting Convective Initiation by Monitoring the Evolution of Moving Cumulus in Daytime GOES Imagery”. Submitted to “IHOP_2002 Convective Initiation Special Issue” of Monthly Weather Review, April 2004. • Hyperspectral satellite data will provide an unprecedented resource for: 1) characterizing the 3-D thermodynamic environment near air-mass/mesoscale boundaries 2) identifying pre-CI signatures for moving cumulus 3) diagnosing the intensity/severity of existing convective storms NWS Training Slide Set John R. Mecikalski, UAH