Lightning Nowcasting using Geostationary Data
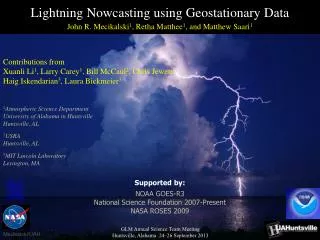
Lightning Nowcasting using Geostationary Data John R. Mecikalski 1 , Retha Matthee 1 , and Matthew Saari 1 Contributions from Xuanli Li 1 , Larry Carey 1 , Bill McCaul 2 , Chris Jewett 1 Haig Iskendarian 3 , Laura Bickmeier 3 1 Atmospheric Science Department

Lightning Nowcasting using Geostationary Data
E N D
Presentation Transcript
Lightning Nowcasting using Geostationary Data John R. Mecikalski1, Retha Matthee1, and Matthew Saari1 Contributions from Xuanli Li1, Larry Carey1, Bill McCaul2, Chris Jewett1 Haig Iskendarian3, Laura Bickmeier3 1Atmospheric Science Department University of Alabama in Huntsville Huntsville, AL 2USRA Huntsville, AL 3MIT Lincoln Laboratory Lexington, MA Supported by: NOAA GOES-R3 National Science Foundation 2007-Present NASA ROSES 2009 GLM Annual Science Team Meeting Huntsville, Alabama 24–26 September 2013
Outline • Evaluating use of GOES 0–1 h lightning initiation (LI) fields indicators within Corridor Integrated Weather System (CIWS). • Coupling GOES-based first flash LI nowcasts to WRF model forecasted flash densities – Nowcasting lightning amounts. • Relationships to Radar: • GOES-12 Imager versus NEXRAD fields for LI events, coupled to environmental parameters. • Polarimetric radar, MSG infrared, and total lightning. • Plans forward… GLM Annual Science Team Meeting Huntsville, Alabama 24–26 September 2013
Project & Science Goals • GOES and Meteosat satellite data can be analyzed to help identify the proxy indicators of the non–inductive charging process, leading to a 30–60 min lead time nowcast of first–flash lightning initiation (LI, of any lightning, not just cloud-to-ground; see Harris et al. 2010). • Main application developments include (2009–Present): • Test a LI nowcast algorithm in the FAA Corridor Integrated Weather System. • Develop a new method to correlate satellite-estimated LI locations to a Weather Research and Forecasting (WRF) model forecasted lightning flash algorithm, to provide a nowcasted “LI-amount” product. • Yet, fundamental relationships have required study: • GOES infrared (IR) fields of developing cumulus clouds in advance of LI, and NEXRAD radar profiles. • GOES IR, NEXRAD radar and environmental parameters (stability & precipitable water, and their profiles; wind shear, cloud base height & temperature). • Polarimetric radar fields as related to IR and total lightning data. • Combining satellite, radar and NWP model data to form an enhanced lightning alert forecast product.
Satellite Detection 12 12 Radar Detection 9 9 6 6 Height (km) 3 3 Time CI Forecast without satellite CI Forecast with satellite Lightning Initiation: Conceptual Idea What is the current LI forecast lead time? From 10-45 minutes added lead time for first flash LI using GOES Imager data Lead time from radar alone is on the order of 10-17 minutes 30-45 min to 75 min LI Forecast?
Satellite LI IndicatorsTheory Strong updraft in mixed-phase region of cloud Non-inductive charging Reynolds et al. (1957) Cecil et al. (2005) McCaul et al. (2009) Geostationary satellites offer time-rate of change information for monitoring growing cumulus clouds. Attempt to detect cumulus clouds with strong updrafts that coincidently undergo glaciation GOES IR and 3.9 µm reflectance fields of cumulus clouds provide proxy information to isolate clouds with sustained, strong updrafts that contain mixed-phase microphysics. Explore forecasting first CG lightning strikes using indicators from the Satellite Convection Analysis and Tracking (SATCAST) system (a.k.a. the GOES–R CI algorithm).
Satellite LI Indicators: Methodology Identify and track growing cumulus clouds from their first signs in visible data, until first lightning. Analyze “total lightning” in Lightning Mapping Array networks, not only cloud-to-ground lightning, to identify for LI. Monitor 10 GOES reflectance and IR indicators as clouds grow, every 15-minutes. Perform statistical tests to determine where the most useful information exists. Set initial critical values of LI interest fields. Evaluate and refine satellite indicators and assess performance. Compare satellite fields with radar, so assess relationships. Related Research Harris, R. J., J. R. Mecikalski, W. M. MacKenzie, Jr., P. A. Durkee, and K. E. Nielsen, 2010: Definition of GOES infrared fields of interest associated with lightning initiation. J. Appl. Meteor. Climatol., 49, 2527-2543. Mecikalski, J. R., X. Li, L. D. Carey, E. W. McCaul, Jr., and T. A. Coleman, 2013: Regional comparison of GOES cloud-top properties and radar characteristics in advance of first-flash lightning initiation. Mon. Wea. Rev. 141, 55-74. Matthee, R., and J. R. Mecikalski, 2013: Geostationary infrared methods for detecting lightning-producing cumulonimbus clouds, J. Geophys. Res. Atmos., 118, doi:10.1002/jgrd.50485. Matthee, R., J. R. Mecikalski, L. D. Carey, and P. M. Bitzer, 2013: Quantitative differences between lightning and non–lightning convective rainfall events as observed with dual–polarimetric radar and MSG satellite data. Mon. Wea. Rev., In review.
SATCAST Algorithm: Lightning Initiation Interest Fields These indicators for LI are a subset of those for CI. They identify the wider updrafts that possess stronger velocities/mass flux (ice mass flux). In doing so, we may highlight convective cores that loft large amounts of hydrometers across the–10 to –25 °C level, where the charging process tends to be significant. Provides up to a 75 lead time on first-time LI. Glaciation Growth Rate Cloud Top Height The 10.7 µm TB, 3.9 reflectance, 15-min 10.7 µm cooling rate, and the 6.5–10.7 µm trend are the most important fields.
MSG Infrared Fields: Lightning/Non-Lightning Events Cloud depth Cloud top Glaciation Updrafts Lightning stormsNon-Lightning storms • Lightning Events: • Strong updrafts, with anvil formation (not seen in non-lightning events) • Clouds continue to deepen after first CG lightning (non-lightning; shallow clouds) • Strong glaciation signature in IR fields (weak signature in non-lightning) Matthee and Mecikalski (2013)
Behavior of MSG Infrared Fields: CG Lightning Events • Main Finding: MSG “interest fields” for growing cumulus clearly delineate CG-lightning from non-lightning cumulonimbus clouds. • Glaciation signatures plus stronger updraft-strength indicators are key. Matthee and Mecikalski (2013)
Lightning indicator values > 4 denote lightning strikes 7/3/11 New Orleans – Threshold Adjustment (25 min lead time) lightning indicators, time 0 lightning indicators, time 0 Removal of false alarms Changes: LI1: –18 °C > 10.7 µm > 0 °C AND 3.9–10.7 µm > 17 °C LI1: 10.7 µm < –5 °C AND 3.9–10.7 µm > 17 °C LI3: 3.9 µm < 0.11 AND 3.9 µm reflectivity 15 min trend is < –0.02 LI3: 3.9 µm < 0.08 AND 3.9 µm reflectivity 15 min trend is < –0.02 Improvement in hits vs. false alarms: 60% hits, 40% FA 67% hits, 33% FA 1832Z 1832Z lightning strikes, time 0 lightning strikes, 20 mins later Use of stability and satellite texture fields in combination with GOES data, with random forest, improves performance to ~84% POD with 20% FARs, based on analysis done at MIT-LL. 1850Z Corridor Integrated Weather System–CIWS 1830Z MIT Lincoln Laboratory
Training: 0–1 hour LI NowcastingFAA Corridor Integrated Weather System (CIWS) Gather Predictor Data Identify LI Regions Machine learning classifier training and predictor selection Far from LI Near LI • Form cloud clusters at time=0 • with mean shift clustering algorithm • Identify Near LI and Far from LI cloud clusters • Gather predictor data under cloud clusters • Identify 20 X 20 km grid areas with • CG strikes in next 1 hr • Remove areas within 80 km of • existing lightning at time=0 • Use CIWS radar track vectors to • align remaining lightning initiation • areas to time=0
LI PredictorsModels, Environment, and Satellite Environmental Stability LAMP • Probability of lightning in • 2 hr windows • Based on observations and operational GFS numerical model • Produced hourly • 20 km horizontal resolution • Based on gridded observations from VLAPS • and RAP operational numerical model • Reflects CAPE and departure from convective temperature • Produced every 15 min • 5 km horizontal resolution Stable Unstable NARRE-TL • Probability of thunderstorms • Based on 10-member time-lagged ensemble • Operational RAP and NAM numerical models • Produced hourly • 13 km horizontal • resolution 10.7 μm Brightness Temperature 3.9 μm Reflectivity LAMP → Localized Aviation Model Output Statistics (MOS) Program NARRE-TL → North American Rapid Refresh Ensemble Forecast System- Time Lagged GFS → Global Forecast System RAP → Rapid Refresh Model NAM → North American Mesoscale Forecast System VLAPS → Variational Local Analysis and Prediction System • Consider 10 GOES LI indicators (Harris et al. 2010) • Produced every ~15 min • 4 km horizontal resolution • Use min, max, spread under cloud cluster
Feature SelectionRandom Forest Importance GOES-R CI and related fields Importance Satellite NWS Numerical Models Environmental Random Control
LI Algorithm Real-time TestingFAA Corridor Integrated Weather System Satellite Environmental Stability Stable 1 Hr LI Probability Field Unstable Feature Extraction Classifier from Machine Learning (gives probability of LI) Numerical Models • Advected forward 1 hour with • CIWS radar track vectors • Probabilities integrated in time Model Training from Historical Data
LI Forecast Example Radar, Visible Satellite and CG Lightning 1 Hr LI Probability Forecast SC GA Observed Lightning Initiation Regions Radar, Visible Satellite and CG Lightning 1 Hour Later 4 August 2012 1730 UTC
Outline • Evaluating use of GOES 0–1 h lightning initiation (LI) fields indicators within Corridor Integrated Weather System (CIWS). • Coupling GOES-based first flash LI nowcasts to WRF model forecasted flash densities – Nowcasting lightning amounts. • Relationships to Radar: • GOES-12 Imager versus NEXRAD fields for LI events, coupled to environmental parameters. • Polarimetric radar, MSG infrared, and total lightning. • Plans forward… GLM Annual Science Team Meeting Huntsville, Alabama 24–26 September 2013
WRF/GOES-R Lightning Initiation & Threat Forecast • Form an algorithms that links 0-1 hour GOES lightning initiation nowcasts to WRF Lightning Flash Algorithm (LFA) forecasts of a short-term lightning threat (source density), or potential lightning amounts per storm. • Explore distance-weighted method to account for expected differences in lightning/storm initiation location and WRF-based lightning forecast location. • Refine GOES lightning initiation methodology using Lightning Mapping Array (LMA) data. • Preparing for GLM and MTG Lightning Imager. Flash Density Key Forecast time and density Observed Lightning GOES-R CI-based 0-1 hr LI nowcasts Lightning Initiation/Potential Forecast Storm evolution WRF Forecast Lightning Initiation -1 Hour +1 Hour +2 Hour
WRF/GOES-R Lightning Initiation & Threat Forecast Methodology GOES-R Convective Initiation algorithm with an LI component: LI events are highlighted. Collecting GOES fields cumulus cloud “objects” in advance of LI. Using 6 GOES IR fields that are currently implemented within the GOES-R Convective Initiation algorithm. Assess relationships between GOES IR fields with respect to time prior to LI (from 5 min to 4 hrs). Compare in time to WRF LFA fields. Perform time–space matching of GOES LI events to WRF storms. Use ensembles of LFA forecasts to help estimate variability/uncertainty.
WRF/GOES-R Lightning Initiation & Threat Forecast Use McCaul et al. (2009) LFA estimates lightning flash density. McCaul, E. W., S. J. Goodman, K. M. LaCasse, and D. J. Cecil, 2009: Forecasting lightning threat using cloud-resolving model simulations. Wea. Forecasting, 24, 709–729. • Dataset currently >50 days/multi-storm cases from North Alabama LMA • More being added from 2013… • Creating flash densities to validate WRF output • NSSL WRF Lightning Flash Algorithm (LFA) output on corresponding days acquired/being processed • Use GOES-R CI tracking tool to obtain IR fields • Current Challenge: Overlaying LFA output to the observed LMA data • Spatial and Temporal difficulties • Looking into using other parameters from LFA output to create a range- weighted and time-weighted approach
Linking LI Nowcasts with WRF Lightning Threat NALMA LI and Source Points WRF Lightning Forecasts Linking lightning events to WRF LFA forecast (challenge)
Linking LI Nowcasts with WRF Lightning Threat 6.5–10.7 µm difference – 4-6 Flash Origin Density 10.7 µm cloud-top TB – 2-4 Flash Origin Density LI LI Time Prior to LI Time Prior to LI 13.3–10.7 µm difference – 4-6 Flash Origin Density 10.7 µm cloud-top TB – 4-6 Flash Origin Density LI LI Time Prior to LI Time Prior to LI • Weak relationships between trend fields (15-min 10.7 µm, 6.5–10.7 µm, 13.3–10.7 µm) and future flash densities. • Satellite data only offers some of the needed information, mostly as expected.
Case Example: 11 June 2011 (1632 UTC) Monitor GOES satellite IR fields for convective development and lightning potential. Base algorithm is GOES–R CI (older version shown).
Case Example: 11 June 2011 (1645 UTC) Monitor GOES satellite IR fields for convective development and lightning potential. Base algorithm is GOES–R CI (older version shown). Main Event
Case Example: 11 June 2011 (1700 UTC) WRF LFA Assess WRF LFA output for 1700 UTC. Lightning is forecasted to occur in NE Alabama with peak flash origin densities ~8-9 flashes(5 min)–1km2
Case Example: 11 June 2011 (1700 UTC) Continue to monitor GOES fields…
Case Example: 11 June 2011 (1715 UTC) Continue to monitor GOES fields…
Case Example: 11 June 2011 (1732 UTC) Based on GOES LI fields at 1645 UTC and WRF LFA output, lightning is highly likely to occur, with peak flash origin densities near 10 flashes(5 min)–1km2.
Case Example: 11 June 2011 (1738 UTC) LMA – “truth” At 1738 UTC Lightning Mapping Array (LMA) shows that lightning initiates from a new convective storm cell in Northeast Alabama. The eventual peak flash origin density for this storm was 13 flashes(5 min)–1km2. Algorithm would have assigned ≤13 flashes(5 min)–1km2 to location of 1645 UTC GOES-identified LI event, along with possible statistics from other WRF-forecasted storms
Case Example: 11 June 2011 (1738 UTC) LMA – “truth” Flash Density Nowcast: Max: 14.4 Ave: 11.0 Med: 10.9 Min: 7.6 Product: Assign a flash density to the GOES-nowcasted event that corresponds to WRF LFA, yet with an ~50 min lead time and with statistics that help provide a forecaster a sense of the uncertainty/variability of the LI nowcast.
Outline • Evaluating use of GOES 0–1 h lightning initiation (LI) fields indicators within Corridor Integrated Weather System (CIWS). • Coupling GOES-based first flash LI nowcasts to WRF model forecasted flash densities – Nowcasting lightning amounts. • Relationships to Radar: • GOES-12 Imager versus NEXRAD fields for LI events, coupled to environmental parameters. • Polarimetric radar, MSG infrared, and total lightning. • Plans forward… GLM Annual Science Team Meeting Huntsville, Alabama 24–26 September 2013
GOES Infrared Fields – Lightning Events (OK & FL) • Tendency for stronger updrafts early in storm’s life in OK, where CAPE’s are larger. • 3.9 µm reflectance show that stronger updrafts in OK lead to more small ice particles at cloud top, and higher reflectance. • Higher reflectance at cloud top in OK is a response to stronger updrafts there. • Well defined anvils in FL at time of LI, and slowing growth versus in OK. • First flash nowcast lead time is >25-35 min using satellite (up to 75 min). • Warm-rain microphysics dominance in FL. growth rate growth rate growth rate growth rate glaciation glaciation Mecikalski et al. (2013)
Polarimetric Radar, MSG, and Lightning View of Convection • Next, determine relationships between infrared (cloud-top) estimates of physical processes (updraft strength, glaciation and phase, and microphysical parameters, e.g., effective radius, cloud optical thickness), dual-polarimetric radar derived hydrometeor fields, and total lightning. • For the NAMMA field experiment region in western Africa. • Focus on lightning and non-lightning case studies, ~30 of each storm type. • Data from NPOL and MSG processed and co-located with lightning observations. • MSG-derived effective radius, optical thickness, cloud-top phase, and cloud-top pressure. • Results: • Found relatively understood relationships between hydrometeor fields, lightning onset, for both lightning and non-lightning events. • MSG data confirm a strong cloud-top glaciation signature at the time when large ice volumes are seen at cloud top. • The presence of well-defined anvils is provided by satellite infrared data when lightning is observed. • Strong updrafts and tall clouds correspond to lightning-producing clouds. • Unique “thresholds” are found in IR observations of cloud producing lightning. Matthee and Mecikalski (2013); Matthee et al. (2013)
Differential Reflectivity t–15 min Time of Lightning graupel Lightning far less ice in non-lightning convection Non-Lightning satellite–radar correspondence Quantify radar ice (mixed phase and cloud top) mass (kg) with MSG channel differences that are typically used to identify glaciation, esp. the 8.7–10.8 µm and [(8.7–10.8 μm)–(10.8–12.0 μm)] differences.
Near-term Plans • Continued testing of LI nowcasts in CIWS/CoSPA, and evaluate value in lightning probability nowcasts for improving efficiency in airport operations (i.e. the “10 mile” rule). • Development of a GOES lightning initiation training database, for HWT demonstration. • Finalize GOES–WRF(LFA) quantitative lightning nowcast product. • Develop further understanding of satellite IR field behavior, in concert with radar observations, across convective regimes. • Combine GOES, polarimetric radar and WRF-LFA into a more complete lightning alert product. • Evaluate how GOES Imager nowcasts of LI can be combined with proxy GLM and MTG Lightning Imager data, for process studies. GLM Annual Science Team Meeting Huntsville, Alabama 24–26 September 2013