Download
1 / 59
590 likes | 618 Vues
An algorithm that uses satellite data to provide a convective initiation nowcast signal, minimizing false alarms and providing radar-like satellite-based CI signal for decision support.

E N D
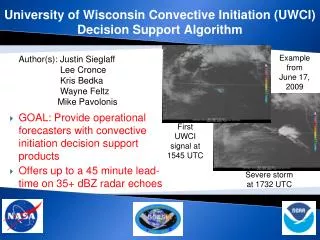
University of Wisconsin Convective Initiation (UWCI) Developed by Justin Sieglaff, Lee Cronce, Wayne Feltz CIMSS UW-MADISON, MADISON, WI Kris Bedka SSAI, HAMPTON VA Mike Pavolonis and Andy Heidinger NOAA/STAR/ASPT MADISON, WI
UWCI Objectives • Provide a CI nowcast signal during day and night • Minimize false alarm at the expense of some probability of detection • Use alternative method for time trend computation (non-AMV) to minimize pixelation • Provide coherent radar-like satellite-based CI signal as direct AWIPS/N-AWIPS satellite convective initiation decision support aid in field
What is output from UWCI? • Value of 0: No CI nowcast • Value of 1: “Pre-CI Cloud Growth”: growing liquid water cloud • Value of 2: “CI Likely”: associated with growing supercooled water or mixed phase cloud • Value of 3: “CI Occurring”: Associated with a cloud that has recently transitioned to thick ice – that is, it has glaciated GROWING MEANS THE CLOUD IS COOLING, BECOMING TALLER Once the cloud has glaciated, UWCI not needed
Characteristics of UWCI • Nowcasts cloud development in regions not dominated by cirrus • Uses only IR channels from GOES satellite • Results available ~2 minutes after satellite scan (distribution to AWIPS takes an additional 5-10 minutes) • Operates in regular and RSO mode • Large spatial coverage: CONUS east of Rockies • Up to 30-45 minutes of lead time before significant radar echoes/lightning strikes • Low FAR, good POD, error sources understood
When should you use UWCI with caution? • Algorithm does not work well where cirrus cloud cover exists • Fast-moving clouds can cause false alarms • Thirty minutes between images? False alarm rate increases • CI is more a diagnostic tool – that is, you lose the good lead times – in true maritime Tropical airmasses • Explosive development? UWCI may be more diagnostic (a function of time resolution)
UWCI: Algorithm logic – an overview in words Box average 11 micron brightness temperature (BT) is calculated for current time and previous time, using specific classes from GOES Cloud Typing product Unfiltered Cloud Top Cooling (CTC) Rate is calculated by differencing box average 11 micron BT for current time from previous time Large/small box approach eliminates most of false CTC due to cloud motion (and additional checks reduce false cooling further) CI Nowcast is assigned to remaining CTC pixels with cooling rates less than or equal to -4.0K/15 minutes by leveraging GOES Cloud Typing product
Which of these cooling points reflects cloud growth (in the vertical) and which reflects cloud motion (in the horizontal)? Also: Convective Initiation should ignore cooling cirrus clouds (where the initiation happened a while ago!)
Supercooled or mixed Glaciation has occurred All liquid & warmer than 32 F
Convection develops where CI predicted it along warm front
10.7 mm data Cloud Mask finds cloudy pixels 13.0 mm data Cloud typing determines the type of cloud 3.9 mm data Surface Emissivity Surface Temperature 6.7 mm data Clear-Sky Atmospheric Absorption/Emission information
Unknown Cloud Mask finds cloudy pixels Clear Fog Cloud typing determines the type of cloud Thick Ice Water Mixed Phase Supercooled Water Cirrus Cirrus overlap
CI not computed for these pixels Unknown Cloud Mask finds cloudy pixels Clear Fog Cloud typing determines the type of cloud Thick Ice Water Mixed Phase Supercooled Water Cirrus Cirrus overlap
ARE THERE TOO MANY ICE PIXELS?
IS THERE MOSTLY THIN CIRRUS WHEN MANY CLOUD TYPES ARE PRESENT?
ARE THE MICRO-PHYSICAL CHANGES ‘WRONG’ ?
ARE THERE TOO MANY ‘OVERLAP’ PIXELS – CIRRUS PIXELS OVER LOW CLOUDS?
IS THE INFERRED THUNDER-STORM UPDRAFT IS TOO WEAK?
Object Tracking Approach for Nowcasting Convective Storm Development Using Geostationary Imagery Develop method to group cumulus cloud pixels into coherent “objects”, which can then be objectively tracked over time (cloud overlap, cross-correlation?) to determine IRW TB cooling rate for each object (NEFODINA, Nowcast SAF RDT, WDSS-II) Coming Soon using WDSS-II! Advantages Explictly tracks cumulus cloud motion, producing accurate time trends of numerous cloud properties Allows for easier and more comprehensive validation of nowcast products Disadvantages Can be very computationally expensive Some current generation methods focus on tracking colder objects (NEFODINA TB < 260 K), missing the initiation phase. RDT is much warmer with max TB suggested to be 278 K. Object 1 at time t Tb= - 20°C Object 1 at time t-15 mins Tb= -10°C Cumulus objects overlap (or “look” very similar) in 2 images…so they must be the same cloud!!! Identify properties such as object size, temperature, mean cloud particle size and microphysical phase changes
20090429 2015 UTC Instantaneous CI Nowcast CI Occurring CI Likely CI Possible
20090429 2015 UTC Instantaneous CI Nowcast CI Occurring (Glaciation) CI Likely (Supercooled/Mixed Phase) CI Possible (All ‘warm’ liquid) (N-AWIPS Screengrab)
29 April 2009 CI nowcast at 2015 UTC KAMA 2018 UTC Base Reflectivity CI likely Non-detection due to cirrus CI occurring KAMA 2035 UTC Base Reflectivity KAMA 2103 UTC Base Reflectivity First echo >= 35 dBZ, 17 minutes after nowcast
20090506 0545 UTC Nocturnal Instantaneous CI Nowcast SD/NE Border Warm Frontal 0545 UTC 0546 UTC 0606 UTC 0615 UTC
University of Wisconsin Convective Initiation (UWCI) • High-level algorithm overview • Compute IR-window brightness temperature cloud top cooling rates for growing convective clouds using a box-average approach • Combine cloud-top cooling information with cloud-top microphysical (phase/cloud type) transitions for convective initiation nowcasts Example from June 17, 2009 over northern KS First UWCI cooling rate signal precedes NEXRAD 35 dBz signal by 37 minutes 1545 UTC – first cloud top cooling signal 1610 UTC - Continued cooling signal First NEXRAD 35+ dBz echo at 1622 UTC NEXRAD at 1735 UTC 1732UTC - Severe t-storm
Eastern CO 20090706 Visible image at 1745Z CTC indicated at 1745Z No radar reflectivity at 1745Z Radar reflectivity at 1908Z
Radar reflectivity in clear air mode at 0115Z CTC on IR4 image at 0110Z IR4 image at 0202Z CTC on IR4 image at 0132Z Radar reflectivity at 0144Z IR4 and CI at 0145Z Radar reflectivity above 28 dBz at 0134Z Again CTC and CI indicated on IR4 band but clouds still appear on visible satellite as well Kansas reported hail (largest 2.75” at 0216Z)
Nebraska 090724: Nocturnal Case IR4 image and CTC at 0245Z Radar reflectivity at 0246Z IR4 image and CTC at 0315Z Radar reflectivity at 0311Z
AWIPS CI/CTC Interaction with Sullivan (MKE) NWS Office CI likely CI occurring Lightning 05:02 UTC 04:30 UTC 06:30 UTC 4:31 Z Forecaster generated screen captures from AWIPS at MKE 5:01 Z 6:31 Z