EKG
EKG. Cardiovascular Anatomy & Physiology. Basic Heart Anatomy. The heart is a muscle made of 3 layers Pericardium aka = pericardial sac is a connective tissue layer around the heart Epicardium is the smooth outer surface of the heart


EKG
E N D
Presentation Transcript
EKG Cardiovascular Anatomy & Physiology
Basic Heart Anatomy • The heart is a muscle made of 3 layers • Pericardiumaka= pericardial sac is a connective tissue layer around the heart • Epicardium is the smooth outer surface of the heart • Myocardiumis the muscular middle layer of heart tissue • It is made of cardiac muscle cells that give the heart the ability to contracts to push out blood 3. Endocardium is the innermost layer of the heart • made up of smooth thin connective tissue • This smooth layer allows blood to flow easily throughout the heart
Basic Heart Anatomy • The heart is a muscle • Referred to as a 2 sided PUMP • Right side • Left side • Each side has 2 hollow chambers ( total of 4 chambers • 2 upper chambers are called=Atrium ( singular) Atria ( plural) • 2 lower chambers are called = Ventricle(s)
Heart Anatomy- CONTINUED • Both upper chambers receive blood back to the heart • RA- receives blood from the superior & inferior vena cava • LA- receives blood from the lungs • Both lower chambers pump blood away from the heart • RV – pumps blood to the lungs for re-oxygenation • LV- pumps blood into the systemic circulation
Basic Heart Anatomy • Valves of the Heart • The 4 valves of the heart allow blood to flow only in one direction • There are 2 sets of valves • Atrioventricular valves • Are located between the atria and the ventricles • Right sided valve is the tricuspid valve • Left sided valve is the bicuspid valve or the mitral valve • Semilunar valves • Serve to prevent blood from flowing back into the ventricles • Right sided semilunar valve = Pulmonary valve is located between the right ventricle and the pulmonary artery • Left sided semilunar valve = Aortic valve is located between the left ventricle and the trunk of the aorta
Heart Anatomy-CONTINUED Atria Are the 2 upper chambers (LEFT & RIGHT) Upper chambers are located in what is called the BASE of the heart Ventricles Are the 2 lower chambers (LEFT & RIGHT ) Lower chamber are located in what is called the APEX of the heart
Heart Anatomy-CONTINUED Blood flow through the heart Refer to handout on cardiac/pulmonary circulation Heart Blood Flow Animation
Basic Physiology of the Heart Cardiac Cycle Stroke Volume Cardiac Output Autonomic Nervous System
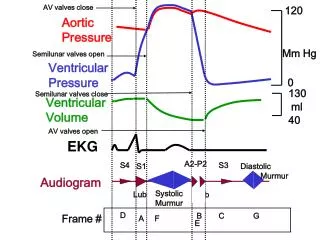
Cardiac Cycle • The heart functions as a unit: • Both atria contract simultaneously then both ventricles contract • Blood is ejected into both the pulmonary and systemic circulation when the ventricles contract • Both the tricuspid and mitral valves will also close during ventricular contraction • The cardiac cycle=Represents the time sequence between ventricular contraction and ventricular relaxation • Systole is ventricular contraction • Diastole is ventricular relaxation • SO--- One cardiac cycle is equal to one systole and one diastole of the ventricle or one heart beat • In a normal heart the cardiac cycle lasts for 0.8 seconds
Stroke Volume • Stroke volume (SV)= is the amount or volume of blood pumped out of the one ventricle in a single beat or contraction • Normal SV is 70 cubic centimeters (cc) per beat • The number of contractions or beats per minute is known as the heart rate • The normal heat rate in an adult is 60-100 beats per minute
Cardiac Output • Cardiac output is the amount of blood PUMPED by the LEFT VENTRICLE in ONE MINUTE • The formula for Cardiac Output is: • CARDIAC OUTPUT(CO) = STROKE VOLUME (SV) X HEART RATE (HR) HR= 80 SV= 70 cc What is the Cardiac Output of this patient in cc’s_______ and in _______liters????
Cardiac Output • Inadequate, CO will result in patients having any of the following symptoms: • Shortness of breath • Dizziness • Drop in blood pressure • Chest pain • Cool and clammy skin
PRELOAD and AFTERLOAD • PRELOAD • Pre-load is the filling pressure of the heart, the pressure the heart has when it is relaxing. (Volume- In) • Afterload • is the RESISTANCE against which the heart must pump • After-load is the pressure of the contracting heart. (Resistance-push- Out) • This pressure will greatly affect the stroke volume and the cardiac output
Autonomic Nervous System • ANS regulates functions of the body that are INVOLUNTARY • Both HR and BP are regulated by this component of the nervous system • There are 2 major divisions of the nervous system: • sympathetic and parasympathetic • The major organs of the body are innervated by both systems with the exception of blood vessels which are only innervated by the sympathetic system
Sympathetic Nervous System • Sympathetic nervous system (or Adrenergic) • 1. Accelerates the heart • 2. Two chemicals are influenced by the sympathetic system – • epinephrine & norepinephrine • 3. These chemicals increase heart rate, contractibility, automaticity, and AV conduction
Parasympathetic Nervous System • Parasympathetic nervous system ( or Cholinergic) • 1. Slows the heart • 2. The vagus nerve is one of this systems nerves, when stimulated slows heart rate and AV conduction.
Basic Electrophysiology Basic Cell Groups • The heart is made up of thousands of myocardial cells • There are 2 basic myocardial cell groups: • myocardial working cells • pacemaker cells of the electrical conduction system • MYOCARDIAL CELLS responsible for generating the physical contraction an d relaxation of the heart muscle • PACEMAKER CELLS • do not contain contractile fragment and can not contract • Responsible for controlling the rate & rhythm of the heart by regulating depolarization
Characteristics of Cardiac Cells Cardiac cells possess primary cell characteristics: • Extensibility • Ability to be stretched • Excitability • Ability of cardiac cells to respond to electrical stimulation • Conductivity • Ability of cardiac cells to receive electrical stimulation and transmit the stimulus to other cells • Contractility • Ability of cells to shorten and cause a muscle contraction • Automaticity • Ability of cardiac pacemaker cells to make their own electrical impulses
ELECTRICAL CELLS OF THE HEART • Electrical cells • a) Make up the conduction system of the heart • b) Are distributed in an orderly fashion through the heart • c) Possess specific properties • (1) automaticity – the ability to spontaneously generate and discharge an electrical impulse • (2) excitability – the ability of the cell to respond to an electrical impulse • (3) conductivity – the ability to transmit an electrical impulse from one cell to the next
MYOCARDIAL CELLS • Myocardial cells • a) Make up the muscular walls of the atrium and ventricles of the heart • b) Possess specific properties • (1) contractility – the ability of the cell to shorten and lengthen its fibers • (2) extensibility – the ability of the cell to stretch
Major Electrolytes that Affect Cardiac Function An electrolyte is a substance with charged components producing positive and negative charged ions • a positive ion is called a cation • a negative ion is called a anion • 3 major cations that affect heart muscle are: • Potassium K+ • Sodium Na+ • Calcium Ca+ • Magnesium Mg
DEPOLARIZATION & REPOLARIZATION • Depolarization and Repolarization • 1. Cardiac cells at rest are considered polarized, meaning no electrical activity takes place • 2. The cell membrane of the cardiac muscle cell separates different concentrations of ions, such as sodium, potassium, and calcium. This is called the resting potential • 3. Electrical impulses are generated by automaticity of specialized cardiac cells • 4. Once an electrical cell generates an electrical impulse, this electrical impulse causes the ions (Na+ rush into the cell making inside more +) cross the cell membrane and causes the action potential, also called depolarization
Depolarization & Repolarization Continued • 5. The movement of ions across the cell membrane through sodium, potassium and calcium channels, is the drive that causes contraction of the cardiac cells/muscle • 6. Depolarization with corresponding contraction of myocardial muscle moves as a wave through the heart • 7. Repolarization is the return of the ions to their previous resting state, which corresponds with relaxation of the myocardial muscle • 8. Depolarization and repolarization are electrical activities which cause muscular activity • 9. This electrical activity is what is detected on ECG, not the muscular activity
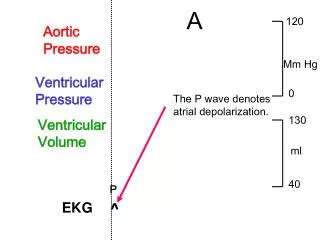
Conduction System THE PATH OF AN ELECTRICAL SIGNAL • Step One: The S-A node creates an electrical signal • The S-A node controls your heart rate, it is called your heart's "natural pacemaker." Electrical signals created by the S-A node travel down pathways to the A-V nodecreating the P WAVE • It has as inherent rate of 60-100 bpm • Step Two: The signal follows natural pathways through both atria. This causes the blood to contract, pushing blood into the ventricles • Step Three: The signal reaches the A-V node. There, the signal pauses very briefly to give the ventricles time to fill with blood. • This delay is seen as the PR interval • Step Four: The signal spreads through the His-Purkinje system. This makes the ventricles contract, pushing blood out to your lungs and body. • This generates the QRS complex • Bundle of His have pacemaker cells that can self-initiate a rate of 40-60 bpm • Purkinje pacemaker fibers are normally within 20-40 bpm
Electrical Conduction VIDEO • Electrical Flow in the Heart
EKG Conduction Animation • Conduction and EKG Waveform Animation
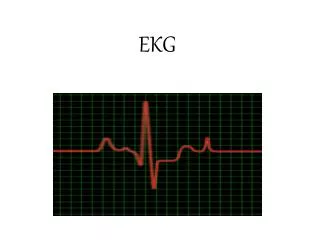
The ElectrocardiogramEKG or ECG • Graphic representation of the electrical activity of the heart • It is a tracing of the electrical activity of the heart NOT the mechanical activity • The machine used to record the activity is called an: electrocardiograph • It is a diagnostic tool
Information Obtainable from EKG RHYTHM ANALYSIS • Heart Rate • Rhythm & regularity • Impulse conduction time intervals • Abnormal conduction pathways • WE CANNOT HOWEVER determine: • Pumping action • Cardiac output • Blood pressure • Cardiac muscle hypertrophy
EKG Machine • An EKG machine is a voltmeter– it reads electrical energy from the body • The heart uses electrical energy to contract muscles
EKG LEADS and ELECTRODES • ELECTRODE is the adhesive pad that contain conductive gel and is placed on the patients skin • LEADS are the wires that are then connected to the electrode– they are color coded to be user-friendly • In order for the machine to give a clear picture– there must be a positive, negative and ground lead • EKG will look at the heart from the positive lead to the negative lead and gives a different view of the heart • The exact portion of the heart being visualized depends on lead placement • This allows for observation of electrical activity in many different parts of the heart
3 Lead EKG- Used for continuous patient monitoring • A 3 lead ECG is considered non-diagnostic so it does not provide a clear view of the entire heart, but instead a basic view of the electrical pathway of the heart triangulated between the 3 leads. • The 3 lead ECG is usually simple to use and most have standardized color coded placement of the 3 electrode leads. These are the most common 3 lead ECG placements: • 3-electrode system - Uses 3 electrodes (RA, LA and LL).- Monitor displays the bipolar leads (I, II and III)- To get best results – Place electrodes on the chest wall equidistant from the heart Will give us a view of the lateral, and inferior portion of the heart
AUGMENTED LEADS:PLEASE NOTE THE FOLLOWING: • EKG Augmented Limb Leads • The same three leads that form the standard leads also form the three unipolar leads known as the augmented leads. These three leads are referred to as aVR (right arm), aVL (left arm) and aVF (left leg) and also record a change in electric potential in the frontal plane. • These leads are unipolar in that they measure the electric potential at one point • We can get additional contiguous (adjoining) views of the heart: • aVL- Lateral • aVF- Inferior
5 Lead EKG • This configuration refers to the standard Holter monitor or the 5 lead rhythm setup • White lead=right sternum/clavicle area • Black lead=left sternum/clavicle area • Red lead=left lower thoracic area • Green lead=right lower thoracic area • Brown lead= just below and to the right of the bottom of the sternum
12 LEAD EKG • Definition- A representation of the heart’s electrical activity recorded from 10 electrodes placed in standard positions on the body surface. • Analogy- Envision the heart as an object placed on a pedestal around which a person can move while taking photographs (different views) from all angles.
12 Lead EKG Provides a Cross Sectional View of the Heart • 12-lead ECG - 10 electrodes required to produce 12-lead ECG.- Electrodes on all 4 limbs (RA, LL, LA, RL)- Electrodes on precordium (V1–6) V1 @4th IC right of sternum V2 @ 4th IC left of sternum V3@ between V2/V4 V4 @ 5th IC midclavicular V5 5th IC between V4/V6 V6 @ 5th IC midaxillary Leads I,II,II are bipolar= this means they have one positive and one negative electrode ( limb leads) • Allows the best interpretation of specific areas of the heart - Inferior (II, III, aVF)- High Lateral Wall(I, aVL) • Lower Lateral Wall( V5, V6) • Septal View (V1-V2) • Anterior View (V3-V4)
Precordial LEAD Placement of the 12 lead EKGV1 @4th IC right of sternumV2 @ 4th IC left of sternumV4 @ 5th IC midclavicularV3 @ between V2/V4V6 @ 5thIC midaxillary V5 5th IC between V4/V6 Lead Placement Visual 12 LEAD EKG PLACEMENT VIDEO
EKG Graph Paper • Arranged in a series of horizontal and vertical lines and squares • Standard in all health care settings • Moves at a constant speed of 25 millimeters per second • Both time and amplitude are measured on EKG graph paper • Time is measured on the HORIZONTAL line • Amplitude is measured on the VERTICAL line • Divided into small squares, each of which is 1 mm in width and equals a time interval of 0.04 second • Darker lines further divide every 5th square, both vertically and horizontally • Each larger square measures 5 mm in height and 5 mm in width and represents a time interval of 0.20 second
EKG Paper and Markings • Divided into small squares, each of which is 1 mm in width and equals a time interval of 0.04 second • Darker lines further divide every 5th square, both vertically and horizontally • Each larger square measures 5 mm in height and 5 mm in width and represents a time interval of 0.20 second • 5 of the large squares all equal one second noted by the small line on the very top of the paper • Most practitioners will print a 6 second strip to interpret a patients rhythm • The squares of on the EKG paper represent the measurement of the length of time required for the electrical impulse to traverse a specific time in the heart
EKG WaveformsP Wave • P wave • Impulse fired by the SA node • The p wave is a smooth rounded upward deflection • Represents depolarization of the atria • It is 0.1 second in duration
PR Interval • Represents the time interval for the impulse to travel for the SA node through the internodal pathway toward the ventricle • Normal PR interval is 3-5 small boxes or 0.12 – 0.20 second in length
QRS Complex • Represents the conduction of the impulse from the Bundle of His through the ventricle muscle or ventricle depolarization • QRS measures less than 0.12 second or less than 3 small boxes on the EKG graph paper
ST Segment • Represents the time interval which the ventricles are depolarized and ventricular repolarization • ST segment is ISOELECTRIC or at baseline
T Wave • Represents ventricular repolarization • Resting phase of the cardiac cycle
U Wave • The U wave is a wave on an electrocardiogram that is not always seen • typically small, and, by definition, follows the T wave • U waves are thought to represent repolarization of the Purkinje fibers.[1]
How is an EKG Interpreted? • Read strip from left to right • Apply the 5 step approach that you will learn • Ask and answer each question in the 5 step approach • You must master the accepted parameters for each dysrhythmia and then then apply those parameters to each of the 5 steps when analyzing the strip.
FIVE STEP APPROACH • Step 1: What is the rate? • Step 2: Is it regular? • Step 3 : Is the complex narrow? • Step 4: Is there a P WAVE? • Step 5: Do all the complexes look the same?
STEP ONE & the 6 Second Method • What is the rate? • Count the number of QRS complexes or number of ventricular beats in one minute -- • Normal heart rate is 60-100 bpm • 6 second method • Simply count the number of QRS complexes in either 3 or 6 second strip • If a 3 second strip is used– X by 20 • If a 6 second strip is used – X by 10