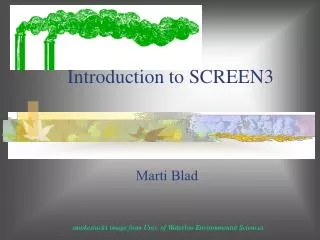
Introduction to SCREEN3
SCREEN3 is a dispersion modeling tool designed to estimate ground-level concentrations of pollutants emitted from single sources under steady-state meteorological conditions. It uses Gaussian distribution principles to represent concentration profiles, allowing users to determine maximum concentrations, distances from emission sources, and effects of atmospheric stability. The model accounts for various input factors such as emission data, receptor locations, and local meteorology. Suitable for point, area, and flare sources, SCREEN3 aids in analyzing air quality impacts effectively.

Introduction to SCREEN3
E N D
Presentation Transcript
Introduction to SCREEN3 Marti Blad smokestacks image from Univ. of Waterloo Environmental Sciences
Historically Image from collection of Pittsburgh Photographic Library, Carnegie Library of Pittsburgh
Gaussian Dispersion z ¤ Dh = plume rise h = stack height Dh H = effective stack height H = h + Dh H h x C(x,y,z) Downwind at (x,y,z) ? y
SCREEN3 Model Assumptions • Continuous pollutant emissions • Conservation of mass in atmosphere • Steady-state meteorological conditions • Concentration profiles are represented by Gaussian distribution—bell curve shape
SCREEN3 designed for… • Single source, short-term calculations • Estimate maximum ground level concentrations • Distance to max. concentration from source • Concentrations at user defined distances • Simple downwash algorithm • Max. concentrations in near & far wake • Estimate concentrations in cavity recirculation zone • Source types • All options for point & flare
SCREEN3 designed for…(cont.) • Full range of meteorological conditions accepted • Stability classes • Wind speeds • Inversion break up • Shoreline fumigation • Determine plume rise for flare releases • Includes effects of BID • Buoyancy induced dispersion • Simple area & volume sources
Dispersion Model Structure INPUT DATA: Operator experience EMISSIONS METEROLOGY RECEPTORS Model does calculations Model Output: Estimates of Concentrations at Receptors
Model Input Considerations • Source type • Point, area, volume, flare • Stack or source emission data • Pollutant emission data • Stack- or source-specific data • Temperature in stack • Velocity out of stack • Receptor data
Input Considerations • Actual pattern of dispersion depends on atmospheric conditions prevailing during release • Major meteorological factors that influence dispersion of pollutants • Atmospheric stability (& temperature) • Mixing height • Wind speed & direction
Meteorological inputs • Appropriate meteorological conditions • Appropriate for location • Appropriate for averaging time period • Wind stability and speed • Flat terrain or complex terrain • Distances to points of interest • Receptors
Review • Dispersion = expand & diffuse • Picture • Gaussian = even spreading directions • Highest along axis • Input data quality critical • Screen3 limitation for reactive chemicals • No reactions assumed to create or destroy
SCREEN3DEMONSTRATION Software provided courtesy of a division of Lakes Environmental Consultants Inc.