Download
1 / 31
310 likes | 464 Vues
ANOVA Demo Part 1: Explanation. Psy 320 Cal State Northridge Andrew Ainsworth PhD. ANOVA works by:. Breaking down participants score into parts

E N D
ANOVA DemoPart 1: Explanation Psy 320 Cal State Northridge Andrew Ainsworth PhD
ANOVA works by: • Breaking down participants score into parts • If everyone is from the same population to start with (before any treatment is given to them) then they should all start at the same mean – the grand mean
Grand Mean Alone Grand Mean
ANOVA works by: • Then states that any distance the subject’s score is away from the grand mean is “caused” of the group they belong to (i.e. which treatment they received, etc.)…
ANOVA works by: • Then states that any difference the subject’s score is away from the grand mean is because of the group they belong to (i.e. which treatment they received) • Plus some random subject variation
ANOVA works by: • If this is done for every person then the Effect (Between Group) Variation and the Random (Within Group) Variation together make up the Total Variability of the participants’ scores around the Grand mean
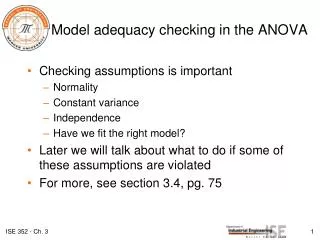
The job of an ANOVA is to • Separate the Real Variation “caused” by the different levels of the IV from the random (“fake”) Variation that is also present • This is sometimes referred to as trying to see the Signal (the real effect) through the Noise (the random variation) • The F-test in an ANOVA is often referred to as a signal-to-noise ratio • So let’s illustrate the pieces of ANOVA…
Total Variability Grand Mean
Between Group Variability Grand Mean
Between Group Variability Grand Mean
Between Group Variability Grand Mean
Between Group Variability Grand Mean
Between Group Variability Grand Mean
Between Group Variability Grand Mean
Between Group Variability Grand Mean
Between Group Variability Grand Mean
Between Group Variability Grand Mean
Between Group Variability + Within Group Variability Grand Mean
Total = Between Group Variability + Within Group Variability Grand Mean
Between Group (with WG shown): Random Differences Alone Grand Mean
Between Group (with WG shown): Real + Random Differences Grand Mean
Summary: ANOVA tries to… • Identify the size of the Random (Average Within Groups) variance so that we have an idea of how large the randomness is in our data • Identify if the Between Groups variance (“caused” by our IV) is large enough for us to believe that it isn’t really just random • Indicate whether our BG variance is significantly large (an not just random) when compared to the Random (WG) variance we identified • Assess the size of the BG ratio by calculating the BG and WG variances and forming the F-ratio (see Part 2)