CPG Industry Leaders Are Asking…
50 likes | 303 Vues
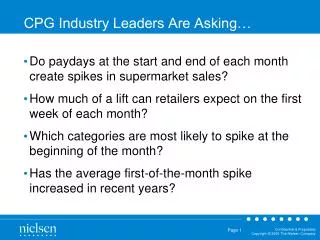
CPG Industry Leaders Are Asking…. Do paydays at the start and end of each month create spikes in supermarket sales? How much of a lift can retailers expect on the first week of each month? Which categories are most likely to spike at the beginning of the month?

CPG Industry Leaders Are Asking…
E N D
Presentation Transcript
CPG Industry Leaders Are Asking… • Do paydays at the start and end of each month create spikes in supermarket sales? • How much of a lift can retailers expect on the first week of each month? • Which categories are most likely to spike at the beginning of the month? • Has the average first-of-the-month spike increased in recent years?
U.S. Supermarket sales clearly spike on the first full week of each month. Source: Nielsen Strategic Planner Thanksgiving & Christmas are the exception. Weekly U.S. Supermarket Sales Week Ending Dates
Supermarket Sales Spikeson First Week of Each Month • On average, U.S. supermarket sales on the first week of the month are 4.3% higher than other weeks excluding the holiday season (Nov-Dec) • This first-week lift is most likely driven by paychecks at the start or end of each month. • This lift occurs nearly every month from January through October. When the month starts in the middle of the week, the lift can be spread out over a 2-week period. • The year-ago 52-week period shows a slightly higher lift at 5.2%. The lift was only 3.5% two years ago. These differences may be attributed to months starting on different days of the week each year. • Some categories see a higher lift on the first week of each month. • Marketers can use this information to fine tune their in-store promotions Source: Nielsen Strategic Planner, Weekly U.S. Supermarket Sales Ending 3/21/09
Supermarket Products Most Likely toSell on the First Week of the Month Nielsen Category Index* Frzn Meat/Seafd (Unprepared) 113 Vegetables-Canned 110 Baby Food 109 Sugar/Sugar Substitutes 109 Soup 109 Vegetables & Grains-Dry 109 Shortening/Oil 108 Packaged Meat 108 Fresh Meat (UPC-Coded) 108 Flour 108 *Index reflects average weekly sales for first week of the month vs. remaining weeks. Excludes last 8 weeks of 2008 (holiday season). First-week-of-the-month categories include food staples and ingredients for cooking from scratch. Many of these skew to lower income or older or Hispanic households. Source: Nielsen Strategic Planner
Supermarket Products LEAST Likely toSell on the First Week of the Month Nielsen Category Index* Candy 96 Skin Care Preparations 100 Frozen Novelties 100 Ice 101 Ice Cream 101 Tobacco & Accessories 101 Gum 101 Shaving Needs 101 Deodorant 101 Wine 101 *Index reflects average weekly sales for first week of the month vs. remaining weeks. Excludes last 8 weeks of 2008 (holiday season). Many of these categories tend to be more discretionary. Source: Nielsen Strategic Planner