Download
1 / 14
140 likes | 299 Vues
Table 8.1 Value Added by Sectors, 2004, billions of dollars (to be continued). (continued) Table 8.1 Value Added by Sectors, 2004, billions of dollars. Figure 8.1 Share of United States Private Economy by Sector, 1869-2004.

E N D
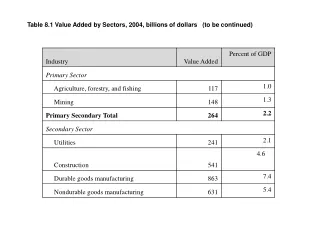
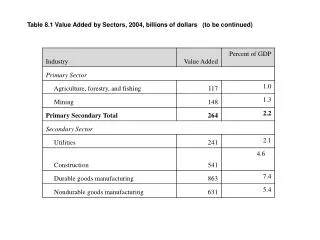
Table 8.1 Value Added by Sectors, 2004, billions of dollars (to be continued)
(continued) Table 8.1 Value Added by Sectors, 2004, billions of dollars
Figure 8.1 Share of United States Private Economy by Sector, 1869-2004
Figure 8.2 Number of Farms, Average Farm Size, and Total Land in Farms, United States, 1850-2002
Figure 8.3 The Allocation of a Dollar Spent on Food in the United States, 2000
Figure 8.4 Energy Consumption in the United States, by Source and Use, 2003
Figure 8.5 Annual Number of Private Housing Starts in the United States, 1965-2004
Table 8.2 Manufacturing Industries in the United States, 2003, Production and Employment (to be continued)
(continued) Table 8.2 Manufacturing Industries in the United States, 2003, Production and Employment
Figure 8.6 Total United States Manufacturing Employment and Manufacturing Employment as a Percentage of Total Employment, 1950-2004
Figure 8.7: Manufacturing productivity compared to average manufacturing wages in the U.S. from 1977 to 2004
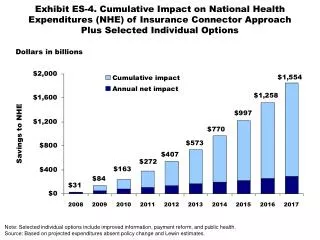
Figure 8.8 Health Care Expenditures in the United States as a Percentage of GDP, 1960-2004
Figure 8.9 Four-firm Concentration Ratios in Retail Industries, 1992-2002
Figure 8.10 Classification of GDP in the United States, 2004