Analyzing Monetary Dynamics in Central and Eastern Europe: Currency Substitution and Demand
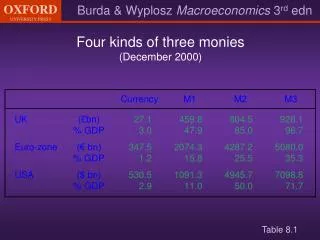
This comprehensive analysis explores the complexities of monetary systems in Central and Eastern Europe, focusing on currency substitution and real money demand. Using data from various sources, including Sahay and Végh (1995) and IMF entries from mid-2000, it evaluates the ratio of foreign currency deposits to broad money and assesses the assets and liabilities of central banks. Additionally, it highlights the effects of inflation on money demand and presents relevant monetary aggregates for countries like France, Germany, the UK, and the USA, illustrated through detailed tables and figures.

Analyzing Monetary Dynamics in Central and Eastern Europe: Currency Substitution and Demand
E N D
Presentation Transcript
Currency substitution* in Central/Eastern Europe(1993) *Ratio of foreign currency deposits to broad money Table 8.2 Source: Sahay and Végh (1995)
Assets of some central banks, mid year 2000 (bn euros) Table 8.3 Source: IMF
Elasticities of real money demand Table 8.4 short run = adjustment within one quarter, long run=complete adjustment
Inflation and money growth in the long run (Rule of thumb*) *Assuming real money demand grows at 3% p.a. Table 8.5
Prices of IKEA mirrors across Europe, 1998 US$ Source: Haskel and Wolf (1999) Table 8.6
Cost of cash inventory (€): Table 8.7
Central Bank Assets Liabilities Consolidated Governmentand Nonbank Private Sector Reserves of commercial banks Foreign assets Assets Liabilities Loans to comm. banks Bank notes held by nonbanks Government and private debt Bank notes held by nonbanks Claims on governments Deposits of private sector Deposits of government Where’sM1? Net worth Commercial Banks Assets Liabilities Vault cash and reserves at Central Bank Deposits of government Liabilities to Central Bank Deposits of private sector Real assets, incl. net worth of banking sector Loans and securities Net worth Figure 8.1 Net worth
Narrow and wide monetary aggregates, France(% of GDP) Figure 8.2 (a)
Narrow and wide monetary aggregates, Germany(% of GDP) Figure 8.2 (b)
Narrow and wide monetary aggregates, UK(% of GDP) Figure 8.2 (c)
Narrow and wide monetary aggregates, USA(% of GDP) Figure 8.2 (d)
Money demand and prices(assuming no real GDP growth) M/P M/P M/P M M P P M P DP/P DP/P>0 DP/P=0 0 0 0 Time Time Time (a) Zero inflation (b) Constant inflation (c) Rising inflation Figure 8.3
Equilibrium in the money market Nominal interest rate 0 Figure 8.4 Real money stock
Expansionary monetary policy A Nominal interest rate A´ 0 Figure 8.5 Real money stock
Increase in real economic activity A´ Nominal interest rate A 0 Figure 8.6 Real money stock
Decline in transaction costs A Nominal interest rate A´ 0 Figure 8.7 Real money stock
Money market disequilibrium B Nominal interest rate A´ A C C´ 0 Figure 8.8 Real money stock
Money, inflation and the nominal exchange rate in the long run: OECD countries, 1970 to present Figure 8.9
Money and long-run growth A´ Nominal interest rate A B 0 Figure 8.10 Real money stock
Nominal interest rates, UK and the Netherlands Figure 8.11
Money demand and hyperinflation in Russia 1992 1993 1994 1995 1996 Figure 8.12
one trip Trips to the bank andaverage money holdings t=0 t=1 two trips t=0 t=1 three trips t=0 t=1 four trips t=0 t=1 Figure 8.13