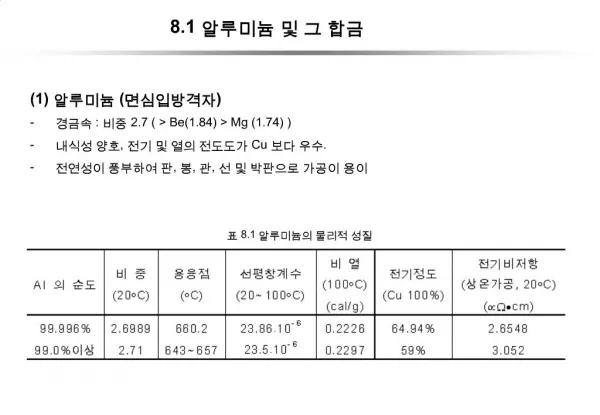
Understanding Polar Coordinates: A New Way to Plot Points
This guide introduces polar coordinates, a method for plotting points using a distance (r) and an angle (θ) instead of the traditional Cartesian (x, y) system. Starting at 0 degrees, we explore how to graph points like (2, 3π/4) and understand that many polar points can occupy the same location, such as (3, 45) and (3, 405). We'll also cover the conversion between polar and rectangular coordinates: from (r, θ) to (x, y) using formulas like (r cos(θ), r sin(θ)). Exercise your understanding with practice problems from page 589.

Understanding Polar Coordinates: A New Way to Plot Points
E N D
Presentation Transcript
8.1 Polar Coordinates
This is a new way to plot points. We will use the polar axis to graph instead of (x,y). We will start at 0 degrees, then go out some distance r and rotate some degree θ. Our points will be labeled as (r, θ).
Keep in mind that unlike in the (x,y) plane where ever point is unique. In the polar plane we can have infinite points that land in the same place. Ex. (3,45) is the same as (3,405) or (3, -315) or (-3, -135) or (-3, 225) all of these land in the same plane. Graphing negative r values can be tricky.
Converting between polar and rectanglar coordinates. If a point P has polar coordinates (r, q) then the rectangular coordinates of P are (r cos(q), r sin(q)). In other words,
Converting from rectangular to polar If a point P has rectangular coordinates (x, y) then the polar coordinates of P is (r, θ) where You need to be careful and think about where in the plane the angle would lie.