Download
1 / 23
230 likes | 254 Vues
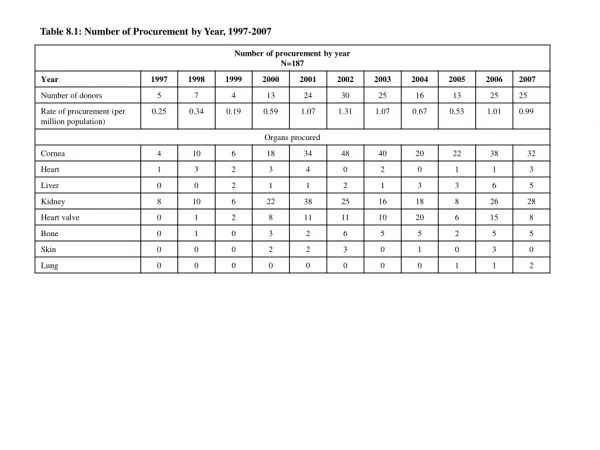
Explore the distribution of donors by year, demographics, nationality, and more from 1997 to 2007. Understand donor patterns and trends over a decade.

E N D
Table 8.2: Potential Donor Referrals and Actual Donations by month, 2007
Figure 8.2: Potential Donor Referrals and Actual Donations by Month, 2007
Table 8.4: Distribution of Donors by Gender, 1997-2007 Figure 8.4: Distribution of Donors by Gender, 1997-2007
Table 8.5: Distribution of Donors by Ethnic Group, 1997-2007 Figure 8.5: Distribution of Donors by Ethnic Group, 1997-2007
Table 8.6: Distribution of Donors by Religion, 1997-2007 Figure 8.6: Distribution of Donors by Religion, 1997-2007
Table 8.7: Distribution of Donors by Nationality, 1997-2007 Figure 8.7: Distribution of Donors by Nationality, 1997-2007
*State of residence according to home address **Others constitute donors who were foreigners, one from Yangon, Myanmar (2003), one from Taiwan (2006) and one from Canada (2007)
Table 8.9: Donor’s Pledged Status, 1997-2007 Figure 8.9: Donor’s Pledged Status, 1997-2007
Table 8.10: Distribution of Donors by Type, 1997-2007 * CD involve tissue donations only Figure 8.10: Distribution of Donors by Type, 1997-2007
Table 8.12: Distribution of Organ Donors by Blood Group, 1997-2007 Blood group is only ascertained in brain dead donors and is not done for tissue donors post -cardiac deaths
Figure 8.12a: Distribution of Organ Donors by Blood Group, 1997-2007
Figure 8.12b: Distribution of Organ Donors by Blood Group (pie chart), 1997-2007 Figure 8.12c: Distribution of Organ Donors by Blood Group (pie chart), 2007
Table 8.13a: Type of hospital/institution where donors originated, 1997-2007 Figure 8.13a: Type of hospital/institution where donors originated, 1997-2007
Table 8.13b: Location where donors were referred from, 1997-2007
Figure 8.13b: Location where donors were referred from, 1997-2007
Table 8.13c: Location where procurement was carried out, 1997-2007 Figure 8.13c: Location where procurement was carried out, 1997-2007


