Download
1 / 27
270 likes | 561 Vues
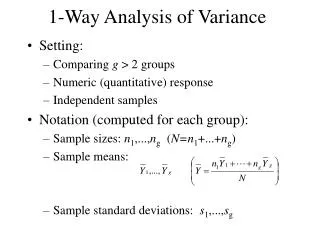
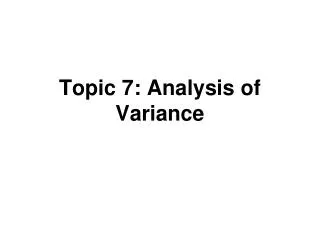
Topic 7: Analysis of Variance. Outline. Partitioning sums of squares Breakdown degrees of freedom Expected mean squares (EMS) F test ANOVA table General linear test Pearson Correlation / R 2. Analysis of Variance. Organize results arithmetically Total sum of squares in Y is

E N D
Outline • Partitioning sums of squares • Breakdown degrees of freedom • Expected mean squares (EMS) • F test • ANOVA table • General linear test • Pearson Correlation / R2
Analysis of Variance • Organize results arithmetically • Total sum of squares in Y is • Partition this into two sources • Model (explained by regression) • Error (unexplained / residual)
Total Sum of Squares • MST is the usual estimate of the variance of Y if there are no explanatory variables • SAS uses the term Corrected Total for this source • Uncorrected is ΣYi2 • The “corrected” means that we subtract of the mean before squaring
Model Sum of Squares • dfR = 1 (due to the addition of the slope) • MSR = SSR/dfR • KNNL uses regressionfor what SAS calls model • So SSR (KNNL) is the same as SS Model
Error Sum of Squares • dfE = n-2 (both slope and intercept) • MSE = SSE/dfE • MSE is an estimate of the variance of Y taking into account (or conditioning on) the explanatory variable(s) • MSE=s2
ANOVA Table Source df SS MS Regression 1 SSR/dfR Error n-2 SSE/dfE ________________________________ Total n-1 SSTO/dfT
Expected Mean Squares • MSR, MSE are random variables • When H0 : β1 = 0 is true E(MSR) =E(MSE)
F test • F*=MSR/MSE ~ F(dfR, dfE) = F(1, n-2) • See KNNL pgs 69-71 • When H0: β1=0 is false, MSR tends to be larger than MSE • We reject H0 when F is large If F* F(1-α, dfR, dfE) = F(.95, 1, n-2) • In practice we use P-values
F test • When H0: β1=0 is false, F has a noncentralF distribution • This can be used to calculate power • Recall t* = b1/s(b1) tests H0 : β1=0 • It can be shown that (t*)2 = F* (pg 71) • Two approaches give same P-value
ANOVA Table Source df SS MS F P Model 1 SSM MSM MSM/MSE 0.## Error n-2 SSE MSE Total n-1 **Note: Model instead of Regression used here. More similar to SAS
Examples • Tower of Pisa study (n=13 cases) proc reg data=a1; model lean=year; run; • Toluca lot size study (n=25 cases) proc reg data=toluca; model hours=lotsize; run;
Pisa Output (30.07)2=904.2 (rounding error)
Toluca Output (10.29)2=105.88
General Linear Test • A different view of the same problem • We want to compare two models • Yi = β0 + β1Xi + ei (full model) • Yi = β0 + ei (reduced model) • Compare two models using the error sum of squares…better model will have “smaller” mean square error
General Linear Test • Let SSE(F) = SSE for full model SSE(R) = SSE for reduced model • Compare with F(1-α,dfR-dfF,dfF)
Simple Linear Regression • dfR=n-1, dfF=n-2, • dfR-dfF=1 • F=(SSTO-SSE)/MSE=SSR/MSE • Same test as before • This approach is more general
Pearson Correlation • r is the usual correlation coefficient • It is a number between –1 and +1 and measures the strength of the linear relationship between two variables
Pearson Correlation • Notice that • Test H0: β1=0 similar to H0: ρ=0
R2 and r2 • Ratio of explained and total variation
R2 and r2 • We use R2 when the number of explanatory variables is arbitrary (simple and multiple regression) • r2=R2only for simple regression • R2 is often multiplied by 100 and thereby expressed as a percent
R2 and r2 • R2 always increases when additional explanatory variables are added to the model • Adjusted R2 “penalizes” larger models • Doesn’t necessarily get larger
Pisa Output R-Square 0.9880 (SAS) = SSM/SSTO = 15804/15997 = 0.9879
Toluca Output R-Square 0.8215 (SAS) = SSM/SSTO = 252378/307203 = 0.8215
Background Reading • May find 2.10 and 2.11 interesting • 2.10 provides cautionary remarks • Will discuss these as they arise • 2.11 discusses bivariate Normal dist • Similarities and differences • Confidence interval for r • Program topic7.sas has the code to generate the ANOVA output • Read Chapter 3