Download

1 / 46
460 likes | 612 Vues
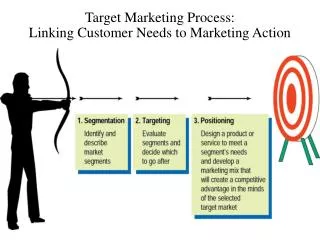
Basic Marketing Research Customer Insights and Managerial Action. Chapter 17: Analysis and Interpretation: Individual Variables Independently. Data Analysis: Two Key Considerations.

E N D
Basic Marketing ResearchCustomer Insights and Managerial Action
Chapter 17: Analysis and Interpretation: Individual Variables Independently
Data Analysis: Two Key Considerations (1) Is the variable to be analyzed by itself (univariate analysis) or in relationship to other variables (multivariate analysis)? (2)What level of measurement was used? If you can answer these two questions, data analysis is easy...
CATEGORICAL MEASURES A commonly used expression for nominal and ordinal measures. CONTINUOUS MEASURES A commonly used expression for interval and ratio measures.
The Avery Fitness Center (AFC) Project RESEARCH PROBLEMS • Discover existing member demographics and usage patterns (including fees paid) • Investigate how members initially learn about AFC
The Avery Fitness Center (AFC) Project • Population: AFC members who had visited AFC at least once in the prior 12 months • Simple random sample • Mail survey; 231 usable responses (58% response rate) • Primary data matched to secondary data (i.e., fees paid over prior 12 months)
Basic Univariate Statistics: Categorical Measures FREQUENCY ANALYSIS A count of the number of cases that fall into each of the possible response categories. …an incredibly common and useful type of analysis
Use of Percentages • Percentages are very useful for interpreting the results of categorical analyses and should be included whenever possible. Unless your sample size is VERY large, however, report percentages as whole numbers (i.e., no decimals)
Frequency Analysis • Researchers almost always work with “valid” percentages which are simply percentages after taking out cases with missing data on the variable being analyzed.
Presenting Frequency Analysis Results GENDER number percent male 45 20% female 177 80% total 222 100% (missing = 9)
Uses of Frequency Analysis • Univariate categorical analysis • Identify blunders and cases with excessive item nonresponse • Identify outliers • Identify the median
OUTLIER An observation so different in magnitude from the rest of the observations that the analyst chooses to treat it as a special case.
HISTOGRAM A form of bar chart on which the values of the variable are placed along the x-axis and the absolute or relative frequency of the values is shown on the y-axis.
The MEDIAN level of education is found by identifying the level that contains the 50th percentile in the frequency distribution.
Confidence Intervals for Proportions (Categorical Measures) CONFIDENCE INTERVAL A projection of the range within which a population parameter will lie at a given level of confidence, based on a statistic obtained from a probabilistic sample. This is why you need to draw a probability sample!
Confidence Intervals for Proportions (Categorical Measures) where z = z score associated with the desired level of confidence; p = the proportion obtained from the sample; and n = the number of valid cases overall on which the proportion was based. CONFIDENCE INTERVAL:
Question: What percentage of AFC members are women? Solution: Compute the 95% confidence interval based on the proportion of respondents in the sample that indicated that they were women.
Based on the sample result, our best guess is that 80% of the population are women…
Therefore, we would be 95% confident that the proportion of women in the AFC population lies between .75 and .85, inclusive.
CAUTION in Interpreting Confidence Intervals • The confidence interval only takes sampling error into account. • It DOES NOTaccount for other common types of error (e.g., response error, nonresponse error). • The goal is to reduce TOTAL error, not just one type of error.
Basic Univariate Statistics: Continuous Measures DESCRIPTIVE STATISTICS Statistics that describe the distribution of responses on a variable. The most commonly used descriptive statistics are the mean and standard deviation.
SAMPLE MEAN The arithmetic average value of the responses on a variable.
SAMPLE STANDARD DEVIATION A measure of the variation of responses on a variable. The standard deviation is the square root of the calculated variance on a variable.
Why Worry about the Sample Standard Deviation? The mean score on a measure of how hot consumers preferred a new sauce to be suggested that they wanted it moderately hot. Unfortunately, most consumers either wanted it mild or hot, with relatively little demand for a moderate sauce.
Confidence Intervals for Means (Continuous Measures) where z = z score associated with the desired level of confidence; s = the sample standard deviation; and n = the total number of cases used to calculate the mean. CONFIDENCE INTERVAL:
Question: How many times per month do AFC members visit the center? Solution: Compute the 95% confidence interval based on the mean number of visits to the Center reported by sample respondents. Based on the responses of 198 AFC members, we learn that the mean number of trips was 10.0, with a standard deviation of 7.3
Therefore, we would be 95% confident that the mean number of trips per month in the AFC population lies between 9 and 11, inclusive.
Converting Continuous Measures to Categorical Measures Sometimes it is useful to convert continuous measures to categorical measures. This is legitimate, because measures at higher levels of measurement (in this case, continuous measures) have all the properties of measures at lower levels of measurement (categorical measures). Why do this?Ease of interpretation
COMMON APPROACHES judgment median split cumulative % breakdowns two-box technique
MEDIAN SPLIT A technique for converting a continuous measure into a categorical measure with two approximately equal-sized groups. The groups are formed by “splitting” the continuous measure at its median value.
The MEDIAN level of education is found by identifying the level that contains the 50th percentile in the frequency distribution.
Using a median split will result in two education groups, a lower education group (64%; less than high school, high school degree, some college, associate’s degree, four-year college degree) and a higher education group (36%; advanced degree). An alternative approach that would produce a more even split of AFC respondents would be to combine those with a four-year or advanced degree as the higher education group.
CUMULATIVE PERCENTAGE BREAKDOWN A technique for converting a continuous measure into a categorical measure. The categories are formed based on the cumulative percentages obtained in a frequency analysis.
If we wanted three approximately equal-sized education groups instead of six, we could use the cumulative percentage breakdown to construct the groups. lower medium highest
TWO-BOX TECHNIQUE A technique for converting an interval-level rating scale into a categorical measure, usually used for presentation purposes. The percentage of respondents choosing one of the top two positions on a rating scale is reported.
Hypothesis Testing THE ISSUE: How can we tell if a particular result in the sample represents the true situation in the population… or simply occurred by chance?
HYPOTHESIS Unproven propositions about some phenomenon of interest. NULL HYPOTHOSIS: The hypothesis that a proposed result is not true for the population. ALTERNATIVE HYPOTHESIS: The hypothesis that a proposed result is true for the population.
SIGNIFICANCE LEVEL (α) The acceptable level of error selected by the researcher, usually set at 0.05. The level of error refers to the probability of rejecting the null hypothesis when it is actually true for the population.
p-VALUE The probability of obtaining a given result if in fact the null hypothesis were true in the population. A result is regarded as statistically significant if the p-value is less than the chosen significance level of the test.
Common Misinterpretations of What “Statistically Significant” Means Viewing p-values as if they represent the probability that the results occurred because of sampling error (e.g., p=.05 implies that there is only a .05 probability that the results were caused by chance). Assuming that statistical significance is the same thing as managerial significance. Viewing the or p levels as if they are somehow related to the probability that the research hypothesis is true (e.g., a p-value such as p>.001 is “highly significant” and therefore more valid than p<.05).
Testing Hypotheses about Individual Variables Categorical Variables CHI-SQUARE GOODNESS-OF-FIT TEST A statistical test to determine whether some observed pattern of frequencies corresponds to an expected pattern.
Testing Hypotheses about Individual Variables Continuous Variables A one-sample t-test can be used to compare a sample mean against an external standard. The analysis is easy to implement in a standard statistical software analysis package.