Download
1 / 39
390 likes | 584 Vues
Finding Success in the Math Classroom. Incorporating the process standards into the daily rigor. Students Struggle with Problem Solving. In Virginia’s Public Schools:. 1. The % of students Advanced on the Grade 3 Math SOL in 2011.

E N D
Finding Success in the Math Classroom Incorporating the process standards into the daily rigor
Students Struggle with Problem Solving
In Virginia’s Public Schools: 1. The % of students Advancedon the Grade 3 Math SOL in 2011. 2. The % of students Advanced on the Grade 3 Math SOL in 2012. The % of ACPS students Advancedon the Grade 3 Math SOL in 2011. 4. The % of ACPS students Advancedon the Grade 3 Math SOL in 2012. The % of POVERTY students Passing the Grade 3 Math SOL in 2011. The % of POVERTY students Passing the Grade 3 Math SOL in 2012. 7. The % of ACPS POVERTYstudents Passing the Grade 3 Math SOL in 2011. 8. The % of ACPS POVERTY students Passing the Grade 3 Math SOL in 2012. 55 13 49 12 85 48 82 53 SOLUTIONS: 12, 13, 35, 48, 49, 53, 55, 82, 85, 88
A New Trend Line in Student Achievement “Virginia's public schools are beginning a new trend line with the implementation of more challenging standards and assessments. The goal is to build on the progress already made under the Standards of Learning program and ensure that all graduates possess the knowledge and skills needed for success in college and the workplace.” - Dr. Patricia I. Wright Superintendent of Public Instruction
A New Trend Line in Student Achievement “…this will be an indication that we are now expecting more of students, not that they are learning less.” - Dr. Patricia I. Wright Superintendent of Public Instruction
Changes to the Mathematics Standards of Learning Content • Increased rigor • Moved content to improve the vertical progression • Removed content from grade levels/subjects • Removed content repeated among grade levels • Added new content
Process Standards for Students Students will… • Become mathematical problem solvers that • communicate mathematically; • reason mathematically; • make mathematical connections; and • Use mathematical representations to model and interpret practice situation
We, as teachers, should be… • Engaging students in the learning, providing relevant and rigorous activities and tasks • Asking high-leverage questions – make students work harder than you • Requiring students to communicate their thinking and listen carefully to them • Making students justify their thinking • Using multiple models Process Goals!
Re-Align Our Instruction • Identify content (Analyze SOL and Curriculum Framework – What students should be able to do?) • 2.Determine acceptable evidence (assessment). • 3. Plan and develop learning experiences & instructional resources/lesson plans.
What do they need to learn? • Identify content (Analyze SOL and Curriculum Framework – What students should be able to do?) • Determine acceptable evidence (assessment). • Plan and develop learning experiences & instructional resources/lesson plans.
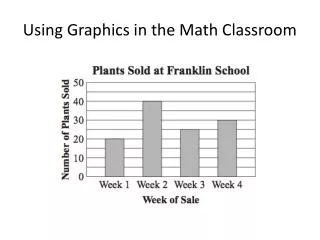
SOL 2.8 The student will create and solve one- and two-step addition and subtraction problems, using data from simple tables, picture graphs, and bar graphs. • •Identify the appropriate data and the operation needed to solve an addition or subtraction problem where the data are presented in a simple table, picture graph, or bar graph. • Solve addition and subtraction problems requiring a one- or two-stepsolution, using data from simple tables, picture graphs, bar graphs, and everyday life situations. • Create a one- or two-step addition or subtraction problem using data from simple tables, picture graphs, and bar graphs whose sum is 99 or less.
SOL 2.3 The student will… Identify the parts of a set and/or region that represent fractions for halves, thirds, fourths, sixths, eighths, and tenths (not just unit fractions); Write the fractions; and Compare the unit fractions for halves, thirds, fourths, sixths, eighths, and tenths.
SOL 3.6 The student will represent multiplication and division, using area, set, and number line models, and create and solve problems that involve multiplication of two whole numbers, one factor 99 or less and the second factor 5 or less. • Model multiplication, using area, set, and number line models. • Model division, using area, set, and number line models. • Solve multiplication problems, using the multiplication algorithm, where one factor is 99 or less and the second factor is 5 or less. • Create and solve word problems involving multiplication, where one factor is 99 or less and the second factor is 5 or less.
SOL 3.3 The student will… Name and write fractions (including mixed numbers) represented by a model; Model fractions (including mixed numbers) and write the fractions’ names; and Compare fractions having like and unlike denominators, using words and symbols (>, <, or =)
How will I know they learned it? • Identify content (Analyze SOL and Curriculum Framework – What students should be able to do?) • Determine acceptable evidence (assessment). • Plan and develop learning experiences & instructional resources/lesson plans.
Ways to Use an Assessment • Formative • Assessment FOR learning • Diagnostic in nature – informs instruction • Questions (verbal), homework, classwork, quizzes, benchmark tests • Observations, checklists, interviews, journals, checklists, reflection activities, self-assessment • Includes a lot of student feedback
Ways to Use an Assessment • Summative • Assessment OF learning • Provides a numeric evaluation • Tests, projects, simulation tests • Less feedback
Performance Task (Grade 2) CANDY BAR TASK Joe has 1/3 of a candy bar. Melinda has 1/2 of a different candy bar. Joe says his piece is larger than Melinda’s. Can this be true? Why or why not? Use pictures, words and numbers to prove your answer makes sense.
How do I help them learn it? • Identify content (Analyze SOL and Curriculum Framework – What students should be able to do?) • Determine acceptable evidence (assessment). • Plan and develop learning experiences & instructional resources/lesson plans.
There is no decision that teachers make that has a greater impact on students’ opportunities to learn and on their perceptions about what mathematics is than the selection or creation of the tasks with which the teacher engages students in studying mathematics. Lappan& Briars, 1995
Instruction • What learning experiences and instructional strategies will promote the desired understanding, knowledge and skills? • How will you best promote the deepening of insight and interest? • How will you prepare students for the assessment(s)?
Questioning Strategies Aligned with Math Process Skills
1 4 Team Turn 2 3
1 4 Team Turn 2 3
Changes to the SOL Assessments Technology Enhanced Items (TEI) • Fill-in-the-Blank • Creation of bar graphs/histograms • Drag and Drop (Click and drag) • Hot-spots (Click on the box): Select one of more “zones/spots” to respond (multiple answers)
Technological Enhanced Items Type 1: Type in your answer (FILL IN THE BLANK)
Technological Enhanced Items Type 2: Click to create a graph or plot a point. (GRAPHS)
Technological Enhanced Items Type 3: Click and Drag (DRAG AND DROP)
“TEI-Like” Items in the Classroom Drag and Drop (Click and drag) • Use of a paper cut out, index card, sticky note, that can be manipulated to answer a question (sort and categorize, order, label, pull from word bank, etc.) • Any matching item or activity
Drag and Drop examples: • Complete sentences or phrases with text • Match a figure to a description (ray, line, line segment, point) • Create change with money • Complete the pattern with a missing figure • Match algebraic properties to examples • Match statement to greater than, less than, equal to
Technological Enhanced Items Type 4a: Click on a box (HOT SPOTS)– unspecified amount of solutions
Hot Spot: • “Circle all of these that are ---” • “Circle the two of these that show---” • “Plot the points that---” • “Shade the part of the model that---”
Hot Spot examples: (Select or plot) • Select all fractions that are equivalent to a given number • Select all set of coins equal to a certain value • Circle all values or expressions that are equal to a certain value (greater than or less than) • Select two names that describe a figure • Select the two equivalent values (the decimal and fraction equivalents)
Hot Spot examples: (Select or plot) • Shade sections of a whole to represent a fraction or decimal • Shade a section of a Venn diagram • Shade the figure that represents a rotation of a figure on a coordinate plane • Select all that are true • Plot values on a number line • Plot the probability of an event
How can you find success? • Instruction, Assessment, and Backwards Design • Focus on the Process Standards • Emulate TEI strategies • Create/Find enriched tasksthat have critical thinking opportunities for students