Download
1 / 59
590 likes | 623 Vues
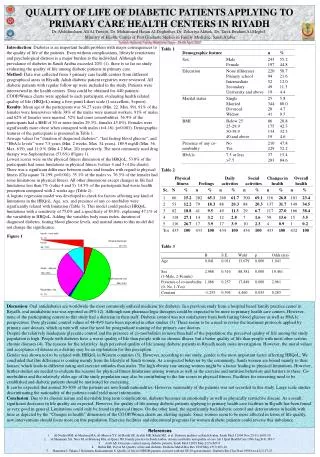
Explore the essence of quality of life: defining, measuring, and applying ordinal ranking methodology in geographical and spatial contexts. Learn how economic development impacts QOL, historical evolution, and exploration of globalization.

E N D
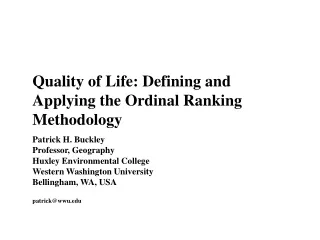
Quality of Life: Defining and Applying the Ordinal Ranking Methodology Patrick H. BuckleyProfessor, GeographyHuxley Environmental CollegeWestern Washington UniversityBellingham, WA, USApatrick@wwu.edu
Talk Outline QUALITY OF LIFE [QOL] • WHAT IS QOL • HOW TO MEASURE QOL • YOU DO IT: HANDS-ON • CONCLUDING REMARKS
Part 1 • WHAT IS QOL
WHAT IS QUALITY OF LIFE • Define QOL • List Applications • Discuss Geographic or Spatial Scale • View Examples
QOL Definition • QOL: Sense of Satisfaction (Happiness, Pleasure, Well Being…) with the Environment in which a group lives • Implies that the Goods and Services and Social Constructs available in an environment create the feeling of satisfaction • The lack of these and/or the existence of Bads indicates a lower quality of life then desired
QOL High High quality of life includes Access to Goods, Services and Participation: • Food, Clothing, Housing • Education • Opportunities for Social Participation • Political Empowerment • Social and Economic Equality • Security
QOL Low Low Quality of Life implies Shortages of Goods, Inadequate Services, and Alienation: • Hungry, Cold, Wet • Uneducated • Discrimination and Inequality • Powerless and Underemployed • Fear, Anger, Despair
QOL and Development Higher Development • Generally Higher Economic Development has lead to Higher QOL • However, Economic Development can also lead to new stresses in an environment and dissatisfaction Examples: • Pollution: Air, Water, Noise • Crowding and Social Disorder • Alienation, Crime and Fear • Terrorism
QOL History QOL Studies originated in 1930s:Since the 1930s, researchers from many fields have investigated and measured the quality of life (QOL) in various geographic areas(Wish, 1986)
QOL and Globalization QOL has been a topic of growing concern globally:Morris D. Morris (1979) has developed a useful statistic, called the Physical Quality of Life Index (POLI), for measuring the relative performances of economies in differing economic systems.
QOL and Globalization continued POLI is a composite index that combines 3 commonly collected measures of social welfare: 1. infant mortality rates, 2. life expectancy at age one, and 3. literacy percentage rates. These measures are statistics by which countries judge the basic health and life chances of their residents.(Stuart, 1984)
Focus of Studies Today Include Private Sector • Marketing • Real Estate • Internet • Resource Management Public Sector • Education • Facility Management • Policy and Planning • Environment Other • Best Places, Schools, Locations • Aging Population • Children
Geographically Studies are preformed at various scales Globally: • Country • Continent • Environmental region Nationally: • Prefecture • State • County Locally: • Neighborhood • Ward • Block
QOL Examples From WWW • ASIAWEEK.com: Asia’s Best Cities http://www.asiaweek.com/asiaweek/features/asiacities2000/ • Children’s Rights Council: Best US State to Raise a Childhttp://www.vix.com/crc/bestStates98.html#ranking • Save the Children: Mother’s Index and Country Ratinghttp://www.savethechildren.org/worldsmothers00/tablepage.shtml
Part 2 • HOW TO MEASURE QOL
HOW TO MEASURE QOL • Overview • Variables • Cultural Milieu • Measurement Methods and Scale • Ordinal Ranking Example
QOL Measurement Overview QOL is considered to be Multi-Dimensional • Involves numerous variables • Within a cultural/psychological milieu Numerous Methodologies are available for combining these variables • Ordinal Ranking, Factor Analysis, Non-Metric Clustering… Geographic or Spatial Scale (aggregation, disaggregation) can greatly effect local results • City block specific to single value for entire country
Variables • Based on Objective of the Study (Asia’s Best Cities has data related to urban life) • Can be biased by organization performing study and selecting the variables (Asiaweek focuses on business interests) • Influenced by secondary data already collected and available (government statisticsand census data popular)
Variables Example Best Place in US to Raise Children
Variables Example, continued Best Place in US to Raise Children • Objective: Find safest places for children • Bias: Political organization that emphasizes children’s legal rights and government intervention • Data: All secondary, mainly emphasizes public health, income, crime, and deviant behavior. No new data.
Cultural Milieu Satisfaction is defined in cultural terms Example: Consider the Arctic Eskimos think of food like polar bears, seals, and fish Sportsmen think of adventure and recreation High fashion models think of fur coats Oil Companies think of petroleum reserves Tourists think of landscapes & quaint natives
Modeling Methodologies • Ordinal Ranking -- most popular, creates a technique for normalizing and summing together a variety of variables • Factor Analysis -- also popular, a sophisticated statistical technique to cluster and order multiple variables • Other clustering or additive techniques also used
ORDINAL RANKING PROCEDURE • Describe Modeling Technique • Show Example • Perform a “hands-on” exercise
Steps After Defining the Goal of the Study: 1. Select Geographic Places/Scale to be Ranked 2. Select Variables used to study the Places 3. Assign measures of value to each Variable 4. Determine utility functions for each Variable and replace Variable measure with corresponding utility measure
Steps continued 5. Rank Variables, highest to lowest 6. Give relative weights to adjacent Variables 7. Calculate absolute weights for entire system 8. Create weighted utility table 9. Rank the Places
Purpose: Example Study • Upon Graduation, Select the best cities to start your career • Best city should have: • Good Market • Good business climate • Good work force • Strong Community Spirit
2.Select Variables used to study the Places Translating Ideas into Variables: Good Market • People Have Jobs = Low Unemployment • People Have Money = High Income Good Business Climate • Costs are Low = Low Housing Cost Good Work Force • People are Talented = Highly Educated Strong Community Spirit • People work together well = Many Volunteers
4. Determine utility functions for each Variable and replace Variable measure with corresponding utility measure Need to Create Measurement System Common to All Variables Problem • Not all variables measured in same units • Example Unemployment is in % and Income is in $ Solution • Translate all variables into “utils” or units of utility
Utility Conversion Equations For a GOOD Uvi = (Xvi - MINv)/ (MAXv - MINv) Notation: Xvi= Variable v measured in units for place i MAXv = Maximum value of variablev MINv = Minimum value of variablev Uvi = Variablevmeasured in "utils" for placei v = subscript representing all variables i = subscript representing all places
Utility Conversion Equations, continued For a BAD Uvi = (MAXv - Xvi)/ (MAXv - MINv)
5. Rank Variables most important to least • Most important Variable Ranked first, next most important ranked second, next third, until all included
6. Give relative weights to adjacent Variables • Indicate how much more important two adjacently ranked variables are, always >1 • Lowest variable assigned weight of one
7. Calculate absolute weights for entire system • Absolute Weights indicate the over-all impact of a variable to the model • Note that the highest ranking variable has the greatest weight
7. Calculate absolute weights for entire system • Actual Calculations
8. Create weighted utility table and sum results • Multiply Utility Measures by Absolute Weights, result is Weighted Utility • Sum Weighted Utility to Determine QOL for a place
Part 3 • YOU DO IT: HANDS-ON
YOU DO IT: HANDS-ON • United Nations Data • Build Modified Human Development Index [HDI] • Investigate Results • Look at Mapped Results