Download
1 / 22
220 likes | 244 Vues
This workshop conducted by the U.S. Nuclear Regulatory Commission and Pacific Northwest National Laboratory in 2005 aimed to demonstrate a multi-thematic modeling capability with emergency planning and response tools. It showcased an automated system linking scientific and emergency response communities in real-time, focusing on water contamination scenarios. The purpose was to illustrate the impacts of releasing an unknown contaminant into a water body and implementing response plans. The workshop highlighted the importance of incident characterization in emergency response and recovery efforts, emphasizing the need for rapid risk assessment tools.

E N D
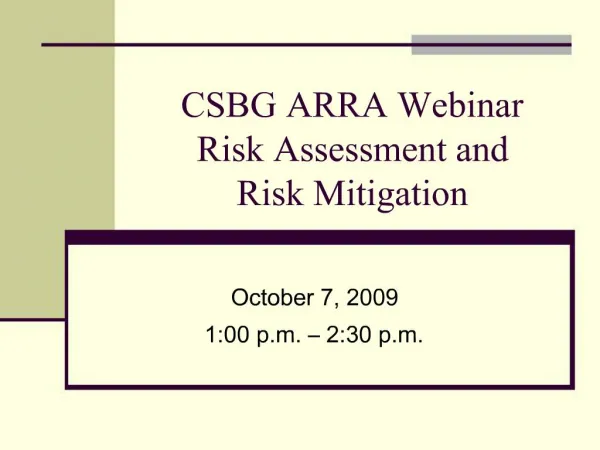
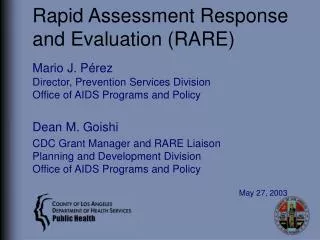
Rapid Risk AssessmentPreparedness, Response, Recovery, and Mitigation Workshop U.S. Nuclear Regulatory Commission Rockville, Maryland Pacific Northwest National Laboratory November 15-17, 2005
Team • Gariann Gelston (HERS), Project Manager • Gene Whelan (NR), Technical Lead • Dave Millard (ISE), EMAdvantage Lead • Chitra Sivaraman (ISE) • Tim Downing (ISE) • Mitch Pelton (HERS), FRAMES Lead • Dennis Strenge (HERS) • Bonnie Hoopes (HERS) • Tarang Khangaonkar (MSL), EFDC Lead • Zhaoqing Yang (MSL) • Cheegwan Lee (MSL) • Lon Hachmeister (MSL) • Mary Simpson/Joan Young (HERS), DS Lead 2
“Multi-Thematic” Modeling Supporters • Engineer Research & Development Center, ACOE • National Environmental Research Laboratory, ORD, EPA • Office of Nuclear Regulatory Research, NRC • Office of Radiation and Indoor Air, OAR, EPA • Office of Environmental Management, DOE • Pacific Northwest National Laboratory, DOE • Multimedia Modeling: $23M ($8M for FRAMES) • FEMIS/EMAdvantage: $42M 3
Purpose • Provide an illustrative example that combines a multi-thematic modeling capability with emergency planning & response tools to create an automated system, which provides a real-time linkage between scientific and emergency-response communities. 4
Introduction • Preparedness, Response, Recovery, & Mitigation • Air is common • Now easily link soil, surface water, groundwater, exposure pathway/routes, decision support, etc. • Integrated Multi-thematic capability, illustrating water • Not Vaporware • Simulated Sensor Data • Pre-run 3-D surface water flow and transport • Real site with real data • Demonstration of actual software actually running 5
Proposition • Release of an unknown contaminant, unknown strength, unknown location to a water body, where a nearby population is potentially exposed • Question: What is the potential impact to the surrounding area, and what response plan do you implement, if the contaminant levels are unacceptable? • Operate Status Board Command & Control system linked with “Multi-thematic Modeling” running in the background 6
Preparation Work • Spatial description of site • Sensors • Contaminants of Concern (CoC) • Exposure scenarios/pathways per zone • Fate & Transport Models (Calibrate/Validate) • Protective/Response Action Plans • Protective Action Thresholds and Recommendations 7
Demonstration Steps • Operational System • Status Board notification through sensors • Incident Identification • Surface Water Back Calculation • Surface Water Transport Forward Calculation • Risk Impact Analysis • Post Protective Action Recommendations 8
Demonstration Steps (cont’d) • Choose and Implement best-fit Protective Action Plan • Evaluate differences between Protective Action Recommendations and Final Protective Action Decision • Re-evaluate in real-time as the assessment requires 9
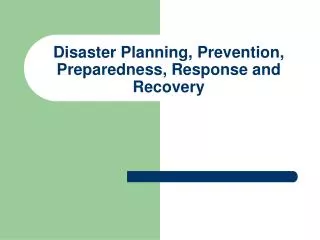
SUMMARY Relationship Between Incident Characterization and Emergency Response & Recovery • INCIDENT • CHARACTERIZATION • HAZARD • ANALYSIS • Area Affected • Impact Estimates • Times / Durations • CONSEQUENCE • ASSESSMENT • Population • Critical Infrastructure WEATHER PRODUCTS SENSOR DATA REPORTS INCIDENT INFORMATION ‘STATIC’ GEO- SPATIAL DATA ALERTS SITE SPECIFIC DATA • EMERGENCY PREPAREDNESS & RESPONSE • Examine Incident Characterization Information • Autonomously Make Protective Action Decisions • Identify and execute Plans and Annexes • Transition from initial response, to sustained response • Transition from Response to Recovery PRODUCT TRANSFER 10
Spatial Description of Site(water, shoreline, land zones; facilities) BACK
S9 S8 S5 S7 S6 S4 S3 Sensor Locations S1 2 km Sensors S2 BACK 12
Protective Action Thresholdsand Recommendations(Water, Shoreline, Land) BACK 14
S9 S8 S5 S7 S4 S6 S3 Sensor Locations S2 S1 2 km Status Board Notification through Sensors BACK
S9 S8 S5 S7 S4 S6 S3 Sensor Locations S2 S1 2 km Incident Identification (sensors exceed threshold) BACK
S9 S8 S5 S7 S4 R6 S6 R5 R3 R4 R2 S3 R1 Sensor Locations S2 S1 Initial Release 2 km Surface Water Back Calculations Estimate Potential Release Points and Source Strengths BACK
Surface WaterTransport Forward Calculation Back Forward
Surface Water TransportForward Calculation ▼ Chosen Source Previous Slide Back
Risk Impact Analysis • ● Overlay plume, which exceeds a threshold, on to zones • ● Identify zones directly impacted by plume • ● Identify zones • indirectly impacted BACK
Post Protective Action Recommendations(Water, Shoreline, Land) BACK
Scenario Comparison Detects Drinking Hazard Index Shower Garden Response Cost Time Contaminant Concentration Probability of Exceedence Concentration Time Is this significant? Rapid Risk Assessment