Download
1 / 23
230 likes | 472 Vues
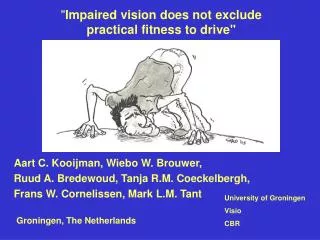
" Impaired vision does not exclude practical fitness to drive". Aart C. Kooijman, Wiebo W. Brouwer, Ruud A. Bredewoud, Tanja R.M. Coeckelbergh, Frans W. Cornelissen, Mark L.M. Tant. University of Groningen Visio CBR. Groningen, The Netherlands. Study on Practical Fitness to Drive of

E N D
"Impaired vision does not exclude practical fitness to drive" Aart C. Kooijman, Wiebo W. Brouwer, Ruud A. Bredewoud, Tanja R.M. Coeckelbergh, Frans W. Cornelissen, Mark L.M. Tant University of Groningen Visio CBR Groningen, The Netherlands
Study on Practical Fitness to Drive of Subjects with Central or Peripheral Visual Field Defects.
practical fitness to drive assessment on the road • Inclusion Criteria and Tests • inclusion: 0.1 < VA < 0.5 and / or • horizontal VF < 1200 • driving experience > 100 000 km • no cognitive impairment (MMSE, Bell’s Test) • ophthalmic screening • visual function: refraction, VA, VF, CS, DA, stereopsis • visual attention: UFOV-like, AFOV, fixation and saccades • practical fitness to drive assessment on the road • driving test in a driving simulator
Assessment of practical fitness to drive intermediate level between medical fitness to drive and driving skill
On-road driving test for assessment of practical fitness to drive • Evaluation by an expert in assessing on-road driving in handicapped persons • using candidate’s own car, if possible • in the regional area of the candidate • comprises city, rural, and highway driving
On-road driving test for assessment of practical fitness to drive • It is evaluated whether someone can drive fluently and safely given his/her impairments and including use of compensations and adaptations
Assessing practical fitness to drive • lateral position control • following distance • speed control • visual scanning and viewing behaviour • perception of traffic signals • passing and overtaking • use of car controls • anticipation and traffic insight • interaction with other traffic participants • Test Ride to Investigate Practical Fitness to Drive (TRIP) comprises tactical and operational aspects:
Assessing practical fitness to drive • Test Ride to Investigate Practical Fitness to Drive (TRIP) comprises tactical and operational aspects: • Mostly 4-point-rating scales on each item • Most aspects broken down to specific situations
Operational score (mechanical handling and dealing with external stimuli) Tactical score (choice of manoeuvres, safety margins, anticipation) Visual score: operational and tactical items with a visual (scanning) component Total score: average of all TRIP items Global score: final expert judgement: fit or unfit Scores derived from TRIP
Visual Field Defect Central Peripheral Central and Peripheral Mild (n=24) (n=36) (n=7) (n=33) visual acuity (logMAR) 0.23 (0.64) 0.74 (0.14) 0.19 (0.72) 0.77 (0.11) horizontal field diameter* (deg) 142 84 91 141 male : female 29:7 4:3 14:19 16:8 age # year (SD) 60 (12) 63 (15) 67 (9) 65 (13) driving license # year (SD) 37 (10) 39 (17) 38 (8) 38 (11) * Goldmann III4 isopter 100 Subjects
Passed Failed 1.8 1.6 1.4 1.2 1.0 0.8 0.6 0.4 0.2 0.0 0 20 40 60 80 100 120 140 160 180 Mild 62% passed Peripheral 42% passed Visual Acuity (ODS) Central 25% passed Central + Peripheral Visual Field Diameter (ODS) Goldmann III 4
2 Of our population 25% of the subjects with VA < 0.5 is “Fit to Drive” 100 9 80 4 17 Percentage passed 60 23 40 14 14 11 18 11 20 0 0 0,5 1 1,5 2 Decimal Visual Acuity Percentage passing the Practical Fitness to Drive Test vs Visual Acuity 100 subjects
100 subjects 100 80 6 Percentage passed 60 18 6 31 40 18 8 3 3 20 In our population visual field diameter shows a weak relation with “Fitness to Drive” 4 0 0 20 40 60 80 100 120 140 160 180 200 Visual Field Diameter (degree) 18 6 8 3 3 4 Percentage passing the Practical Fitness to Drive Test vs Visual Field Diameter
Predictive power (regression analysis) pass/fail Practical Fitness to Drivetest explained variance R2 predictor model 1 visual acuity (logMAR) .20 visual field (VFS) .24
Predictive power (regression analysis) pass/fail Practical Fitness to Drivetest explained variance R2 predictor model 1 visual acuity (logMAR) .20 visual field (VFS) .24 AFOV, threshold presentation time .32 model 2 visual attention (UFOV-like) .23 contrast sensitivity (log CS) .34 age .34
Predictive power (regression analysis) pass/fail Practical Fitness to Drivetest Contribution of driving simulator performance
180 degree horizontal field ‘3 km in town centre’ ‘15 km on a 2-lane road’ ‘20 km on a highway’ 14 intersections
1.8 1.6 1.4 1.2 1.0 0.8 0.6 0.4 0.2 0.0 0 20 40 60 80 100 120 140 160 180 Results in the driving simulator Mild 62% passed Peripheral 42% passed peripheral visual field defect accidents: 23% mild visual field defect accidents: 9% Visual Acuity (ODS) central visual field defect accidents: 35% Central 25% passed Central + Peripheral Visual Field Diameter (ODS) Goldmann III 4
visual acuity (logMAR) .20 visual field (VFS) .24 AFOV, threshold presentation time .32 Predictive power (regression analysis) pass/fail Practical Fitness to Drivetest explained variance R2 predictor model 1 .38 .47 plus driving simulator variables model 2 visual attention (UFOV-like) .23 .34 contrast sensitivity (log CS) age .34 .35 plus driving simulator variables .45
Conclusions • a considerable percentage of the subjects demonstrated to drive safely • selection based on vision, attention and driving simulator data exclude many people who are fit to drive • selection based on the performance on the task itself (driving) seems to be more fair
study 1: • http://www.ub.rug.nl/eldoc/dis/medicine/t.r.m.coeckelbergh/ • study 2: • http://www.ub.rug.nl/eldoc/dis/ppsw/m.l.m.tant/ General Conclusion: • Compensatory Driving Behaviour has to be assessed in • an Practical Fitness to Drive test