Insightful Spatial Analysis Methods for Data Visualization
Discover how spatial analysis methods turn raw data into useful information, revealing hidden patterns and relationships within geographic features. Learn about selection, measurements, reclassification, overlay analysis, and Boolean logic in GIS. Dive into vector and raster overlays, buffer generation techniques, and the power of vector analysis for detailed data processing. Enhance your understanding of spatial data analysis to extract meaningful insights.

Insightful Spatial Analysis Methods for Data Visualization
E N D
Presentation Transcript
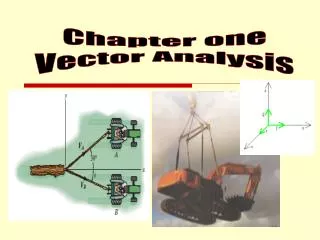
Vector Analysis Ming-Chun Lee
Spatial Analysis • What is Spatial Analysis? • Spatial analysis is a set of methods whose results change when the locations of the objects being analyzed change. • Turning raw data into useful information • Reveal things that might otherwise be invisible
Spatial Analysis • Turning raw data into useful information • Extracting or creating new information about a set of geographic features and examining the relationships between them. • The set of geographic features used in spatial analysis could pertain to data within only one layer or within two or more layers depending upon the users needs.
Spatial Analysis • Methods range from simple to sophisticated • Usually involves manipulations or calculation of coordinates or attribute variables with a various operators (tools), such as: • Selection • Measuring • Reclassification • Dissolving • Overlay • Buffering
Selection • Can be invoked on spatial and attribute components • Selection by Attributes • Selection by Locations • Involves selective search • No new objects created • example: lots owned by foreigners (attribute) • example: lots along the substation buffer (location)
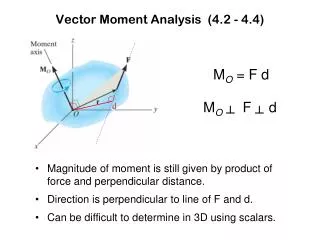
Measurements • Getting numerical values that describe aspect of data • Length • Area • Many tasks require measurement from maps • measurement of distance between two points • measurement of area, e.g. the area of a parcel of land
Reclassification • Classification - identify a set of characteristics to group together objects. • In a vector system, classification involves addition of objects characteristics. (join a table) • In a raster system, classification involves converting or coding cell values. • Classification examples: Land parcels for housing are classed into single-family and multi-family • Classification provides new patterns/relationships
URBAN RESIDENTIAL URBAN INDUSTRIAL URBAN RURAL AGRICULTURE RURAL RURAL FOREST GENERALIZED CLASSIFICATION ORIGINAL CLASSIFICATION Reclassification
Overlay Analysis • Combination of different data layers • Both spatial and attribute data is combined • Produces new layers • Involves two or more data layers • You can only overlay or analyze two themes • But you can combine two into one and then deal with the third one and so one; input theme can be point/line/polygon, but overlay needs to be a polygon • All themes need to be spatially registered • Need to have same coordinate system
Overlay Analysis • Until the arrival of GIS • Map overlay analysis was performed manually • Superimposing transparent map layers on a light table to identify sites simultaneously meeting a number of criteria • Overlay operations can be performed in vector/ raster-based GIS • Overlay operation is a key analytical capability of a GIS • New data can be created by combining two or more input data
Vector vs. Raster • Vector Overlay • Raster Overlay URBDP 498w - Introduction to GIS in Planning
Vector Overlay • Based on geometry and topology • Vector overlay operation results in a more complex output layer • More polygons / intersections / line segments than input layers • Calculates new topology and associated attributes • More time-consuming, complex and computationally expensive, in comparison with raster-based overlay operations
Raster Overlay • Cell by cell process which results in the combination of the two input layers • known as map algebra • operations include boolean, multiply, and algebra
Three Types of Vector Overlay • Point-in-Polygon • Points are assigned attribute of polygon • E.g. wildlife (point) and assoc. with vegetation (poly) • Line-in-polygon • Original lines are dissected by polygon boundary • Lines will have attribute of lines and polygons • E.g. roads and soil types along roads • Polygon-on-polygon • Each new polygon will have attribute from both • E.g. elevation and vegetation or elevation and rainfall
Boolean Logic • Determines the binary properties of features • True-false, yes-no, or presence-absence • Rather than using numbers and magnitudes of features • Reduces measures to some binary condition • Simplifies the results of overlay operations
Boolean Logic A NOT B A A&B B B NOT A • Union (A or B) • Intersection (A & B)
Buffering • Common GIS operation • A type of proximity analysis where a buffer zone is created to perform a search • Buffer: encloses point, line, or polygon at specified distance. • Search: specify a distance from a point (radius), line (corridor), area (area) • New spatial objects created
Buffer Generation • Buffering a Point • All area within one mile of a city • Buffering a Line • All areas within 100 meters of a road • Buffering an Area • All areas within 500 meters of a wetlands area.
Buffer Generation • Buffering possible with raster or vector data models
Vector Analysis • Overlays for Trimming Diverse Layer Extents • CLIP • ERASE • Combining Similar Layers with Different Extents • MERGE • UPDATE • Creating Proximity-Based Polygon Layers: BUFFER • Dissolve • ArcMap Dissolve Regions • ArcToolbox Dissolve • Overlays for Merging Diverse Layers • UNION • INTERSECT • IDENTITY
DISSOLVE (I) • ArcMap • GeoProcessing Wizard • Operates onShapefiles, Coverages • Merges Non-Adjacent Polygons A D C B E D A C D
DISSOLVE (II) • ArcToolbox • Dissolve • Operates on Coverages • Doesn’t Merge Non-Adjacent Polygons A D C B E D A C E
UNION • Combine Only the CommonExtents of Both Layers • Preserve All Attributes URBDP 498w - Introduction to GIS in Planning
INTERSECT • Combine Full Extents of Both Layers • Preserve All Attributes
IDENTITY • Combine Only the Extents of the Original Layer • Preserve All Attributes URBDP 498w - Introduction to GIS in Planning
CLIP • Trim the Original Layer to Only the Extents of the Clip Layer • Preserve Only the Original Layer’s Attributes URBDP 498w - Introduction to GIS in Planning
ERASE • Trim the Original Layer to Exclude the Extents of the Clip Layer • Preserve Only the Original Layer’s Attributes URBDP 498w - Introduction to GIS in Planning
MERGE/APPEND • Add Non-Overlapping Extents of Multiple Layers • Preserve Consistent Attributes
UPDATE • Add Overlapping Extents of Multiple Layers • Preserve Consistent Attributes • Within Shared Extents, Give Preference to Newer Layer
BUFFER • Create a Polygon Layer with Boundaries at a Specified Distance from Another Layer • Fixed Distance • Variable Distance Based on an Attribute • Series of Buffers
BUFFER • Fixed Distance • Examples: • Walking Distance to Bus Stops • Areas of Street Light Illumination
BUFFER • Variable Distance Based on an Attribute • Examples: • Noise Levels By Street Type
BUFFER • Series of Buffers • Examples: • Walking Distance to Bus Stops • Areas of Street Light Illumination
Tools for Spatial Analysis • All of these tools are found in ArcToolbox in ArcMap
Example of Vector-Based Analysis • Find suitable sites for a new arboretum • Site Criteria: • Within county limit • Deep, Fertile, Loamy Soils • Forested Land • More than 1 km from major rivers • Between 2 and 4 kms from major roads