Download
1 / 17
170 likes | 190 Vues
Learn about point estimation and interval estimation for determining the approximate value of population parameters based on sample statistics. Understand how to estimate the population mean and proportion, and how to determine the appropriate sample size for estimation.

E N D
CONCEPTS OF ESTIMATION As its name suggests, the objective of estimation is to determine the approximate value of a population parameter on the basis of a sample statistic. An estimator of a population parameter is a random variable that is a function of the sample data. An estimate is the calculation of a specific value of this random variable. We can use sample data to estimate a population parameter in two ways; Point estimator Interval estimator
Definition 1 A point estimator draws inferences about a population by estimating the value of an un known parameter using a single value or point. Definition 2 An interval estimator draws inferences about a population by estimating the value of an unknown parameter using an interval that is likely to include the value of the population parameter
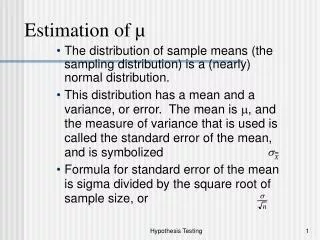
ESTIMATING THE POPULATION MEAN, WHEN THE POPULATION VARIANCE IS KNOWN Suppose that a population has unknown mean and known variance 2. A random sample of size n is taken from this population, say : X1, X2, . . . Xn. The sample mean is reasonable point estimator for the unknown mean . A 100(1-) percent confidence interval on can be obtained by considering the sampling distribution of the sample mean Therefore, the distribution of the statistic : is a standard normal distribution
so that This equation says that, with repeated sampling from this population, the proportions of value of for which falls between This interval is called the confidence interval estimator of
Definition : If is the sample mean of random sample of size n from a population with known variance 2, a (1-)100% confidence interval on is given by Is the upper where percentage point of the standard normal distribution. Note : The probability (1- ) is called the confidence level is called the lower confidence limit (LCL) • is called the upper confidence limit (UCL)
SELECTING THE SAMPLE SIZE TO ESTIMATE A POPULATION MEAN One of the most common questions asked of statistician is, how large should the sample taken is a survey be? The answer to this question depends on three factors: the parameter to be estimated the desired confidence level of the interval estimator the maximum error of estimation, where error of estimation is the absolute difference between the point estimator and the parameter; for example, the point estimator of is , so in that case: error of estimation The maximum error of estimation is also called the error bound and is denoted B.
Suppose the parameter of interest in an experiment is the population mean . The confidence interval estimator (assuming a normal population, with the population variance known ) is : • If we want to estimate to within a certain specified bound B, we will want the confidence interval estimator to be : As a consequence, we have : solving for n, we get the following result ; sample size necessary to estimate to within a bound B
CONFIDENCE INTERVAL ON A PROPORTION It is often necessary to construct a confidence interval on a proportion. Suppose that a random sample of size n has been taken from a large (possibly infinite) population and that X (n) observations in this sample belong to a class of interest. is a point estimator of the proportion of the population p that belong to this class. Then If, X ~ BIN (n,p), we known that the sampling distribution of is approximately normal with mean p and variance Thus,
To construct the confidence interval on p, note • that : • so that :
Definition : Confidence Interval on a Proportion If is the proportion of observations in a random sample of size n that belong to class of interest, then an approximate 100 (1-) percent confidence interval on the proportion p of the population that belongs to this class, is : where is the upper percentage point of the standard normal distribution.
CHOICE OF SAMPLE SIZE Since is the point estimator of p, we can define the error in estimating p by If we set and solve for n, the appropriate sample size is (*) The sample size from equation (*) will always be a maximum for p = 0,5 that is, p(1-p) 0,25. In other words, we are at least 100 (1-) percent confident that the error in estimating p by is less than B if the sample size is
CONFIDENCE INTERVAL ON THE MEAN OF A NORMAL DISTRIBUTION, VARIANCE UNKNOWN When sample size are small (n 30), we must use another procedure. The usually assumption is that the population is normally distributed. This leads to confidence intervals based on the t distribution. Let X1, X2, . . . , Xn be a random sample from a normal distribution with unknown mean and unknown variance 2. The sampling distribution of the statistic is the t distribution with (n-1) degrees of freedom.
Definition : Confidence Interval on the mean of a Normal Distribution, Variance unknown If and s are the mean and standard deviation of a random sample from a normal distribution with unknown variance 2, then a 100 (1-) percent confidence interval on is given by where is the upper percentage point of the t distribution with (n-1) degrees of freedom.
CONFIDENCE INTERVAL ON THE VARIANCE OF A NORMAL DISTRIBUTION Suppose that we wish to find a confidence interval estimate for the variance 2 of a normal population. If X1, X2, …Xn is a random sample of size n from this normal population and if S2 is the sample variance, then S2 is a reasonable point estimator of 2. Futhermore, S2 is used in finding the confidence interval for 2. If the population is normal, the sampling distribution of : is chi-square with (n-1) degrees of freedom.
To develop the confidence interval : so that : This last equation can be rearranged as :
Definition : Confidence Interval on the Variance of a Normal distribution. If s2is the sample variance from a random sample of n observations from a normal distribution with unknown variance 2, then a 100 (1-) percent confidence interval on 2 is : and are the upper and the where lower percentage points of the chi-square distribution with (n-1) degrees of freedom respectively.
ONE SIDED CONFIDENCE INTERVALS To find a 100 (1-) percent lower-confidence interval on 2, giving by : The 100 (1-) percent upper-confidence interval is :