Download
1 / 5
50 likes | 90 Vues
A comprehensive action plan for improving livestock productivity through policy review, project analysis, and stakeholder engagement. Recommendations focus on addressing low productivity, fodder shortage, and genetics value to boost the sector's contribution to GDP and rural livelihoods.

E N D
ACTION PLAN • 1st Week • Review of Current Policy Documents • Present Status of Policies Recommendations’ Implementation • Review of Completed / Abandoned Projects and Ongoing Projects • Draft Report – 20th February
Action Plan • 2nd Week • Identification of Key Issues in Development Projects (Stakeholders Workshop) • Recommendations on Production Models Based on the Potential Ecological Zones • Identification of Short Term Development Projects (28th Feb)
Weakness- low productivity • Shortage of fodder, poor management practices and poor genetics value • % of cattle with % of buffalo with Ave. production Ave- production Liter / day Liter/day < 10 > 10 < 10 > 10 90 % 1% 98% 2%
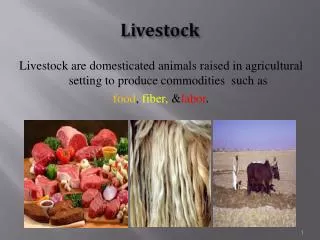
Importance of Livestock • Livestock sector has emerged a leading sector of agriculture over the past 15 years • Share in national GDP 11% • Share in Agriculture GDP 52% • 30-35 million people of rural areas are engaged in livestock raising & deriving 30-40 percent of their incomes • Share of L/S in Agriculture growth has jumped from 25.3 in 1996 to 52 percent in 2010. • Value of milk alone is higher than combined value of 2 major crops (wheat & cotton)